In our last lesson, we began exploring measures of dispersion by looking at the range. We discovered that while simple, its reliance on only two data points makes it a crude and often misleading measure of spread. This highlighted the need for a more robust metric—one that incorporates every data point to give a truer picture of variability.
This lesson introduces two of the most fundamental concepts in all of statistics: variance and standard deviation. They are the workhorses for quantifying data spread. Our goal is to understand the logic behind their calculation, to perform the calculations for a sample, and, most importantly, to interpret what these values tell us about a dataset's structure. This will provide you with a far more powerful and reliable tool for data analysis than the range.
From Deviations to Variance
To build a measure of spread that uses all data points, a logical starting point is to consider each point's distance, or deviation, from the mean. However, if we simply sum up all these deviations (), the positive deviations (for points above the mean) and negative deviations (for points below the mean) will always cancel each other out, resulting in a sum of zero. This tells us nothing about the spread.
To solve this, statisticians square each deviation before averaging them. Squaring makes all values positive, so they accumulate rather than cancel. This average of the squared deviations from the mean is called the variance.
The resource below explains this reasoning very clearly.
Standard Deviation and Variance
This article from Maths Is Fun provides a simple, intuitive introduction to variance and standard deviation.
First, read the initial definitions for Standard Deviation and Variance. Then, jump to the end of the page and read the footnote section Why square the differences?. It does an excellent job of showing why summing simple or absolute deviations is less effective than summing squared deviations.
As you've read, squaring not only solves the zero-sum problem but also gives more weight to larger deviations, a property that is mathematically useful. The squaring operation leads us to the core concept of variance.
Population vs. Sample: The n-1 Enigma
The exact formula for variance depends on whether you have data for the entire population or just a sample.
-
Population Variance (): If you have data for every member of a population (a rare scenario), you calculate the variance by taking the average of the squared deviations from the population mean (), dividing by the total number of data points, .
-
Sample Variance (): More commonly, we work with a sample to estimate the population variance. Here, we use the sample mean () and divide by , where is the sample size.
Why divide by and not ? This is a crucial point in statistics. The sample mean, , is calculated from the sample itself. By its nature, it is the value that minimizes the sum of squared deviations for that specific sample. This means the deviations from the sample mean tend to be smaller than the deviations from the true (and unknown) population mean, . If we divided by , our estimate of the variance would be systematically too low (a biased estimate).
Dividing by the smaller number (this is called Bessel's correction) inflates the variance estimate just enough to correct for this underestimation, giving us a more accurate, or unbiased, estimate of the true population variance.
The following videos provide excellent intuition for this concept, which is often termed "degrees of freedom."
Variance and Standard Deviation: Why divide by n-1?
This video from zedstatistics directly tackles the question of why we use n-1.
Watch the section that begins with the second key question, "Why do we divide by n minus one?". The explanation using the two data points and the sample mean's position is particularly insightful. Then, continue watching the final section on degrees of freedom, which provides another powerful way to understand this concept.
Calculating the Mean, Variance and Standard Deviation, Clearly Explained!!!
To reinforce this idea, this video from StatQuest with Josh Starmer offers a complementary explanation.
Watch the segment explaining how to estimate the population variance from a sample. Notice how he explains that dividing by n-1 "compensates" for using the sample mean instead of the population mean.
Standard Deviation: Making Variance Interpretable
While variance is a powerful mathematical tool, its units are squared (e.g., dollars-squared, meters-squared), which makes direct interpretation difficult. The solution is simple: we take the square root of the variance to get the standard deviation.
The standard deviation returns the measure of spread to the original units of the data, making it far more intuitive. It represents a "typical" or "standard" distance of a data point from the mean.
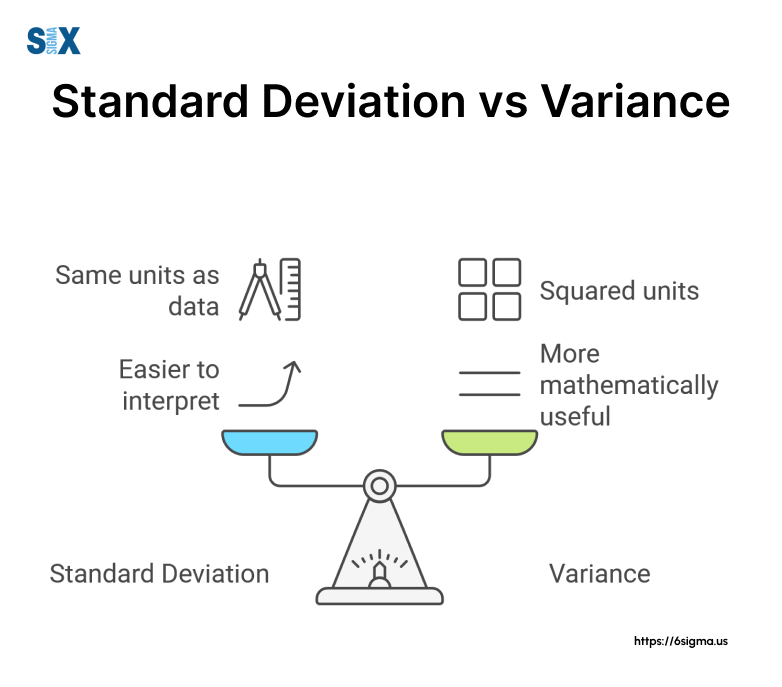
The article from JMP explains this relationship well.
This article clearly distinguishes between variance and standard deviation for interpretation.
Read the short section titled "What is the difference...". It concisely explains why standard deviation's units make it the preferred measure for reporting and interpretation.
Calculation in Practice
Let's put this all together. Since we almost always work with samples in data science, we will focus on the sample standard deviation ().

The steps to calculate the sample standard deviation are algorithmic:
- Calculate the sample mean ().
- For each data point , calculate its deviation from the mean ().
- Square each of these deviations.
- Sum all the squared deviations.
- Divide the sum by to get the sample variance ().
- Take the square root of the variance to get the sample standard deviation ().
Let's walk through an example.
Standard Deviation and Variance
The "Maths Is Fun" article provides a step-by-step calculation that is very easy to follow.
Read through the main example about the heights of dogs. Follow the calculation of the mean, the variance, and finally the standard deviation. Then, read the next section, "But... there's a small change...", which shows how the calculation changes from the (incorrect) population formula to the (correct) sample formula for this scenario.
Interpreting Standard Deviation
The final, and most important, step is interpretation. A standard deviation value tells you how tightly the data are clustered around the mean.
- A low standard deviation indicates that the data points tend to be very close to the mean. The data is consistent and has low variability.
- A high standard deviation indicates that the data points are spread out over a wider range of values. The data is less consistent and has high variability.
Just as with the range, the standard deviation is also sensitive to outliers, though less extremely so, because the outlier's large deviation gets squared.
The image Calculating Standard Deviation also shows a "Normal Distribution Curve" with percentages (68%, 95%, 99.7%). This is a preview of a powerful concept called the Empirical Rule, which we will study later. It states that for many bell-shaped datasets, a predictable percentage of data falls within one, two, or three standard deviations of the mean. This demonstrates just how useful the standard deviation is for understanding a distribution's shape and for making statistical inferences.
Conclusion
In this lesson, we moved beyond the simple range to two of the most important measures of dispersion: variance and standard deviation. You now have a robust method for quantifying and interpreting the spread of your data.
Key Takeaways:
- Variance is the average of the squared deviations from the mean. It uses all data points but results in squared units.
- Standard Deviation is the square root of the variance. It is the most common measure of spread because its units match the original data, making it highly interpretable.
- When calculating variance or standard deviation from a sample (which is almost always the case), we divide by , not . This provides an unbiased estimate of the true population parameter.
- A smaller standard deviation means data is tightly clustered around the mean; a larger one means it is more spread out.
While standard deviation is a fantastic measure of spread, how do we use it to compare the variability of two datasets that have very different scales or units (e.g., comparing the variability of house prices in dollars to the variability of their sizes in square feet)? This is where standard deviation alone falls short. In our next lesson, we will introduce the coefficient of variation, a measure that solves exactly this problem.