Introduction
Welcome to the final lesson in our module on customer segmentation. In our previous lessons, you've done the heavy lifting: you've built a K-Means clustering model, determined the optimal number of clusters, and, most importantly, interpreted those clusters to create rich, actionable business personas like "Striving Stephanie" and "Dormant Derek."
You now have a static model that describes your current customer base. But what happens next week, when a hundred new customers sign up? Do you add them to the data and rebuild the entire model from scratch? This would be inefficient and, more critically, could change your cluster definitions, making your carefully crafted personas unstable.
Today's lesson addresses this exact scenario. We will focus on how to use the Append Cluster tool to assign new data points to existing clusters. This process, often called "scoring" in a predictive context, allows you to apply your stable, pre-built clustering model to new, incoming data. By the end of this 60-minute lesson, you'll be able to keep your customer segments up-to-date without redefining them every time.
1. The Challenge: Scoring New Data with a Clustering Model
In supervised modeling, like the regression models we'll see later, "scoring" new data means predicting an outcome variable. In the context of unsupervised clustering, "scoring" means assigning a new data point to one of the existing clusters. The goal is to determine which cluster's centroid is closest to the new data point in the multi-dimensional space defined by your analysis variables (e.g., age, income, spending score).
This approach is crucial for two main reasons:
- Stability: Your personas and the business rules built around them remain consistent. If a new customer is classified as a "Striving Stephanie," it's because they fit the established profile, not because the profile itself has shifted.
- Efficiency: Scoring new records is far faster than re-calculating all cluster centroids for your entire customer base.
The tool in Alteryx designed for this specific task is the Append Cluster tool.
2. The Append Cluster Tool in Action
The Append Cluster tool is found in the Predictive Grouping tool palette, right alongside the K-Centroids analysis tools you're now familiar with. Its function is straightforward: it takes a clustering model and a dataset and appends the appropriate cluster assignment to each record in the dataset.
To understand how to use it, let's look at its configuration and how it fits into a workflow.
First, to introduce the tool and its connections, please read the following brief section from the Billigence article we've used before.
Cluster Analysis Explained | Alteryx & Tableau
This reading from the 'Cluster Analysis Explained' article by Billigence will show you where the Append Cluster tool fits in a workflow and what its output looks like.
Please read section '7.', which starts with 'Use the Append Cluster tool...'. Focus on the two images that show how the tool is connected in a workflow and the resulting data with the new 'Cluster' column.
As you saw, the tool itself has a very simple configuration.

The real key to using this tool correctly is understanding its inputs, especially when working with new data. The tool has two input anchors:
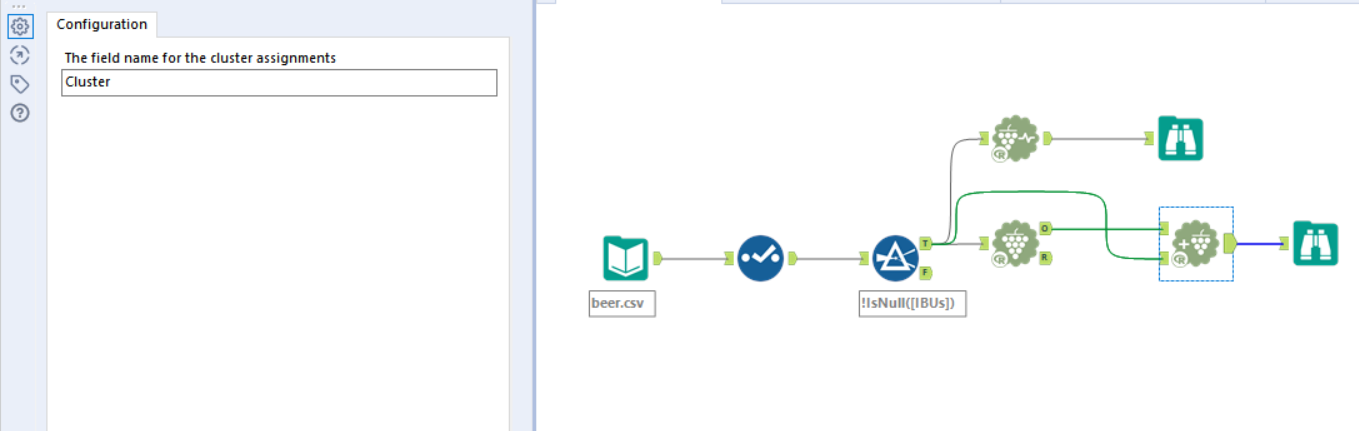
Ofor Object: This anchor receives the model object. You connect theOoutput anchor from yourK-Centroids Cluster Analysistool here. This object contains the definitions of your clusters (i.e., the final positions of the centroids).Dfor Data: This anchor receives the data you want to score. In our scenario, this would be your new customer records. This dataset must contain the same fields with the same data types that you used to build the original model.
The following workflow diagram perfectly illustrates the pattern for scoring new data.
3. Practical Application: Assigning New Customers to Segments
Now, let's put this into practice. We will simulate a scenario where you have a "training" dataset to build your model and a "new customers" dataset to score.
Please follow these steps in a new Alteryx workflow. We'll use a single input file and then split it to simulate the two datasets.
Step 1: Set Up the Data
- Use the
Input Datatool to bring in the customer dataset you have been using for this module. - Add a Sample tool (from the Preparation palette) after the Input Data tool.
- In the Sample tool's configuration, select First N records and set
N = 100. This will be our "training" data for building the model. Add aBrowsetool after it to see the output. - Add a second Sample tool, also connected to the initial
Input Datatool. - In this second Sample tool's configuration, select Skip 1st N records and set
N = 100. This will give us the rest of the records, which we will treat as our "new customers" data. Add aBrowsetool here as well.
Your initial setup should look something like this:
(This is a conceptual image, your tool IDs will differ)
Step 2: Build the Clustering Model
- From the output of your first Sample tool (the "training" data), add a K-Centroids Cluster Analysis tool.
- Configure it as you did in the previous lesson:
- Select the numeric fields for clustering (e.g.,
Age,Annual Income (k$),Spending Score (1-100)). - Use the Z-Score standardization method.
- Set the Number of clusters to the optimal number you identified previously (let's assume it's 4, 5, or 6 based on your prior analysis).
- Select the numeric fields for clustering (e.g.,
Step 3: Score the New Data
- Drag an Append Cluster tool onto the canvas.
- Connect the
O(Object) output anchor from your K-Centroids Cluster Analysis tool to theOinput anchor of the Append Cluster tool. - Connect the output of your second Sample tool (the "new customers" data) to the
D(Data) input anchor of the Append Cluster tool. - Add a
Browsetool to the output of the Append Cluster tool.
Your final workflow should look conceptually like the one from the LINK image we reviewed earlier.
Step 4: Run and Verify
Run the workflow. When it finishes, click on the final Browse tool connected to your Append Cluster tool. In the results window, you will see the data for your "new customers." If you scroll to the far right, you will find a new column named Cluster, containing a number that assigns each new customer to one of your existing segments.
You have now successfully scored new data against a pre-built model!
Conclusion
This lesson completes our exploration of the K-Means clustering workflow in Alteryx. You've not only learned how to build and interpret a model but also how to operationalize it by scoring new data, which is essential for any real-world application.
Key Takeaways:
- Scoring new data against an existing clustering model is preferable to re-building the model, as it ensures stability and efficiency.
- The Append Cluster tool is the designated tool for this task in Alteryx.
- The tool requires two inputs: the model Object (
O) from the K-Centroids Cluster Analysis tool and the new Data (D) you wish to score. - For the tool to work, the new data must have the same fields and data types that were used to train the original model.
Preview of the Next Lesson:
With this lesson, you've completed the Unsupervised Learning module. You are now able to build an end-to-end customer segmentation solution. As your workflows become more complex, making them run efficiently becomes increasingly important. In our next module, "Workflow Optimization and Management," we will begin by learning how to use Performance Profiling to identify and diagnose bottlenecks in a workflow. This skill will help you build faster, more scalable solutions in Alteryx.