Introduction
Welcome to a new module focused on a critical skill for any advanced Alteryx user: Workflow Optimization and Management. In our previous modules, you've built progressively more complex workflows, culminating in the customer segmentation model that used multiple data streams and predictive tools. As your workflows grow in size and complexity, their performance—how fast they run—becomes increasingly important. A workflow that takes 30 minutes to run is much less useful than one that produces the same result in 30 seconds.
This lesson is the first step toward mastering optimization. We will focus on a fundamental diagnostic skill: how to use Performance Profiling to identify and diagnose bottlenecks in a workflow. Instead of guessing which parts of your process are slow, you will learn how to use Alteryx's built-in tool to get precise measurements for every tool on your canvas.
1. What is Performance Profiling?
Before you can fix a slow workflow, you need to know why it's slow. Is it a large input file? A complex join? An inefficient formula? Guessing can lead to wasted effort. Performance Profiling is Alteryx's answer to this problem.
When enabled, it measures the time it takes for each tool to process all its records and execute its function. After the workflow runs, it presents a report detailing each tool's contribution to the total runtime, both in milliseconds and as a percentage. This allows you to immediately pinpoint the "bottlenecks"—the tools that are consuming the most time.
To get a formal introduction to this feature, please read the following brief sections from two articles on Alteryx optimization.
Turbocharging Alteryx Performance: Optimize Workflows for ...
First, this section from an article by 'useready.com' provides a concise overview of what Performance Profiling does and why it's crucial for optimization.
Please read the section titled 'Enable Performance Profiling in Alteryx'. It's a short paragraph that explains the core function of this feature.
Optimising Your Workflows in Alteryx and Best Practice
Next, this section from a Medium article offers a similar definition and adds a detail about how the time is measured.
Please read the two bullet points under the 'Performance Profiling' heading. Notice that it mentions the time is returned in milliseconds.
As both resources highlight, the goal is to make informed decisions. By understanding which tools are the performance bottlenecks, you can focus your optimization efforts where they will have the most impact.
2. How to Use Performance Profiling
Using this feature involves two simple steps: enabling it before you run your workflow and then interpreting the results after the run is complete.
Enabling Performance Profiling
You can enable Performance Profiling in the Workflow Configuration window.
- Click on any empty space on your workflow canvas.
- In the Configuration window, navigate to the Runtime tab.
- Check the box for Enable Performance Profiling.
That's it. The next time you run the workflow, Alteryx will gather the performance data.
Reading the Results
Once the workflow finishes, the performance data appears in the Results window. For each tool, you will see a message displaying its processing time and what percentage of the total workflow runtime it used.
The image below shows this process in action. You can see the checkbox in the Runtime tab and the corresponding output in the Results window. The most important column in the results is the percentage, as it immediately draws your attention to the most time-consuming parts of your workflow.
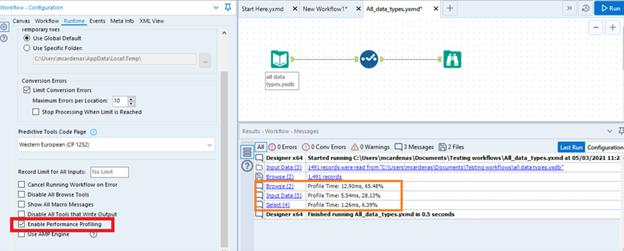
When analyzing the results, look for tools with a high percentage. A tool that takes up 80% of your workflow's runtime is the primary bottleneck and your first target for optimization. Tools that take less than 1% are likely not worth your time to investigate.
Common bottlenecks often include:
- Input Data / Output Data tools: Reading from or writing to large files or slow network locations.
- Join, Find Replace, and Spatial Match tools: Complex matching processes can be computationally expensive.
- Sort tool: Sorting large datasets requires a lot of memory and processing.
- Predictive tools: Tools like the K-Centroids Cluster Analysis tool from our last lesson can be intensive, as they often perform complex calculations.
3. Practical Application: Profiling Your Clustering Workflow
Now, let's apply this to a workflow you've already built. This will give you a practical feel for how to diagnose a real-world process.
-
Open the workflow you created in our last lesson (the one that uses the
K-Centroids Cluster AnalysisandAppend Clustertools). If you don't have it saved, quickly rebuild it by following the steps from the previous lesson's "Practical Application" section. -
Enable Performance Profiling by clicking on the canvas, going to the Runtime tab in the Workflow Configuration window, and checking the box.
-
Run the workflow.
-
Analyze the results in the Results window. Look through the messages and answer the following questions for yourself:
- Which tool had the highest execution time percentage?
- Was it the
K-Centroids Cluster Analysistool, as might be expected from a predictive tool? Or was it anInput Datatool? - Are there any other tools that stand out, perhaps taking 5-10% of the total time?
This exercise shows how simple it is to get a clear, data-driven picture of your workflow's performance. You are no longer guessing; you are diagnosing.
Conclusion
In this lesson, you've learned the essential first step in workflow optimization. By using Performance Profiling, you can move from "my workflow is slow" to "my workflow is slow because the Join tool on line 54 is taking 75% of the total runtime." This precision is the key to effective and efficient optimization.
Key Takeaways:
- Performance Profiling is Alteryx's built-in feature for measuring the execution time of each tool in a workflow.
- It is enabled via the Workflow Configuration > Runtime tab.
- The results are displayed in the Results window after a workflow run, showing each tool's runtime in milliseconds and as a percentage of the total.
- The primary goal is to use this data to identify bottlenecks—the tools consuming the most time—so you can focus your optimization efforts effectively.
Preview of the Next Lesson:
Identifying the bottleneck is only the first half of the process. The next logical question is, "What do I do about it?" In our next lesson, we will begin to answer that question by exploring several fundamental optimization techniques, such as filtering data as early as possible, using the Select tool to remove unnecessary data, and optimizing how you configure your Join tools.