Introduction
In our last lesson, we established a robust method for choosing the optimal number of clusters and evaluating their statistical quality. You learned how to use the K-Centroids Diagnostics tool and interpret metrics like the Calinski-Harabasz Index to ensure your clusters are both cohesive and distinct. We have successfully grouped our data into statistically sound segments.
However, a collection of numbered clusters is not yet useful for a business. The real value comes from understanding who is in each cluster. That is our goal today. This lesson focuses on how to interpret cluster profiles to create business-relevant segment personas. We will transform our numerical clusters into rich, descriptive profiles that can inform strategic decisions, such as targeted marketing campaigns or new product development.
By the end of this lesson, you will be able to look at the output of a clustering model and tell a compelling story about each customer segment, turning raw data into actionable business intelligence.
Part 1: Decoding the Cluster Profiles
Our first step is to analyze the characteristics of each cluster. The primary tool for this is the report generated by the K-Centroids Cluster Analysis tool, which we used in the previous two lessons. Specifically, we are interested in the table that shows the center, or centroid, of each cluster.
This table details the average value for each variable within each cluster. Because the variables you used for clustering (e.g., age, income, spending score) might have very different scales, Alteryx standardizes them (typically using a z-score) so they can be compared fairly.
Here's how to interpret these standardized values:
- A value of 0 means that for this variable, the cluster's average is the same as the overall average of all your data.
- A positive value (e.g., +1.2) means the cluster's average is above the overall average. The larger the number, the further above average it is.
- A negative value (e.g., -0.8) means the cluster's average is below the overall average.
By scanning across the rows (clusters) and down the columns (variables), you can quickly build a "fingerprint" for each segment.
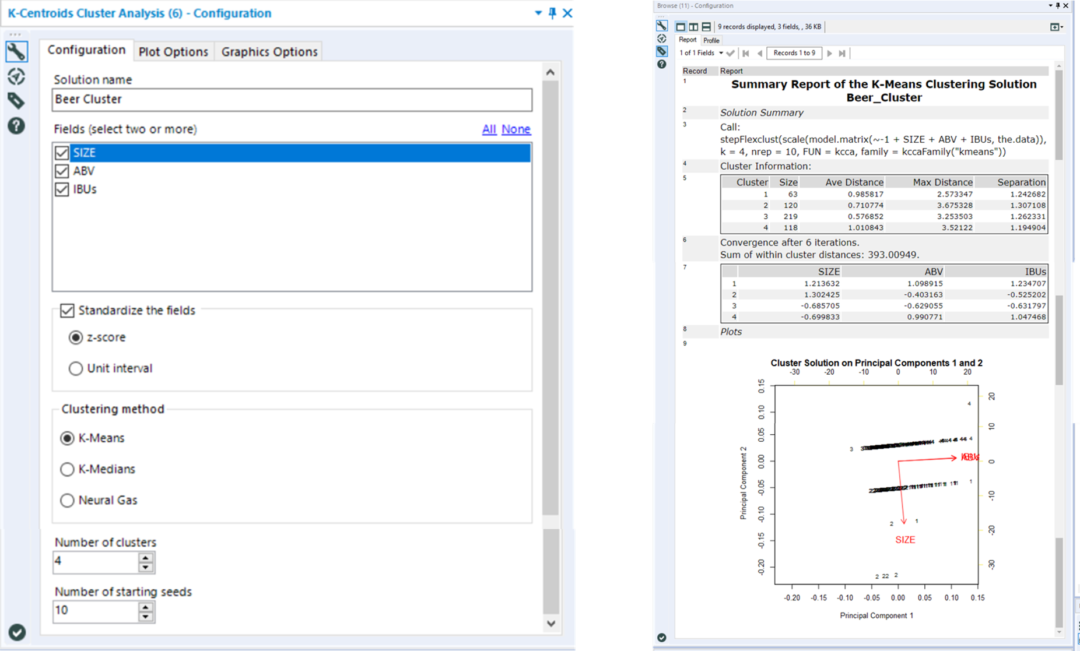
In the example image above, we can see that Cluster 4 has a strongly positive value for 'ABV' and 'IBUs' but a negative value for 'SIZE'. This suggests it represents products that are strong and bitter but come in smaller serving sizes. This is the essence of interpreting a cluster profile.
Part 2: From Numbers to Narratives
Once you understand the numerical profile of each cluster, the next step is to translate these numbers into a clear, descriptive narrative. This involves comparing the clusters against each other and using domain knowledge to add context.
To see how this is done in practice, let's explore an article that walks through this exact process.
Cluster Analysis Explained | Alteryx & Tableau
This article provides an excellent walkthrough of interpreting cluster characteristics and offers general principles for effective interpretation.
First, read the example where the author analyzes four clusters using box plots and descriptions based on 'age', 'annual income', and 'spending score'. You can find this just before the 'Comparing Alteryx and Tableau' heading. Then, read the section titled 'How to interpret a cluster?'. Focus on how they translate visual data and statistics into a narrative for each cluster.
As you saw in the article, the process moves from statistical analysis to qualitative description. The author translated the data into statements like:
- "...cluster two consists of young adults in their mid-30s to 40s with the highest annual income and highest spending score."
- "...cluster four consists of middle-aged adults with a high annual income but lowest spending score."
The article also highlights three key principles for good interpretation:
- Comparison: Don't analyze a cluster in isolation. Its characteristics are most meaningful when compared to other clusters. What makes Cluster 2 different from Cluster 4?
- Domain Knowledge: Your understanding of the business context is crucial. If you're segmenting retail customers, knowledge of purchasing behavior helps you understand why a high-income group might have a low spending score (e.g., they may be "savers" or shop at a competitor).
- Spread: Look at the variance within a cluster. A tight cluster (low variance) means the members are very similar, making the persona more reliable.
A practical tip for this stage is to use Alteryx's visualization tools, like the Interactive Chart or Basic Table, to view the un-standardized average values for each cluster. This can make the profiles more concrete. For example, seeing an average income of "$120,000" is often more intuitive than seeing a z-score of "+1.5".
Part 3: Crafting Actionable Business Personas
The final step is to elevate your descriptive narratives into rich, memorable personas. A persona is a fictional character representing a specific customer segment. This is the most effective way to communicate your findings to non-technical stakeholders, like a marketing or sales team.
A good persona goes beyond a simple label like "High Spenders." It has a name, a story, and a set of defining characteristics that make it feel real and relatable. This helps business users empathize with the customer group and design strategies specifically for them.
The image below provides an excellent example of how cluster data can be transformed into well-defined personas.
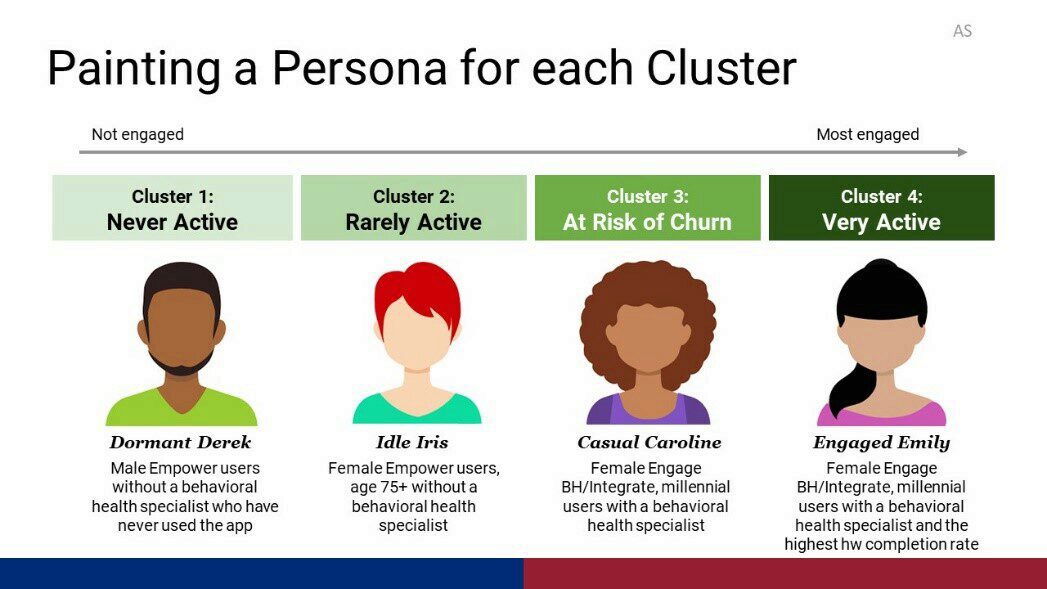
By creating these personas, the analysis becomes instantly actionable:
- The marketing team can design a re-engagement campaign specifically for "Dormant Derek".
- The product team can look for ways to help "Striving Stephanie" achieve her goals more effectively.
- The customer success team can learn from the habits of "Engaged Emily" to encourage similar behavior in other users.
This is the power of translating your K-Means clustering results into a business-relevant format.
Conclusion
In this lesson, you've learned the critical final step in the clustering process: interpretation. You now know how to move from a statistically validated model to actionable business insights.
Key Takeaways:
- Start with the Centroids: The standardized mean values in the K-Centroids Cluster Analysis report are the key to understanding the unique profile of each cluster.
- Translate Numbers to Narratives: Use comparison and your domain knowledge to describe the characteristics of each segment in plain language.
- Create Personas for Impact: The ultimate goal is to create memorable personas (like "Engaged Emily") that make your segments relatable and actionable for business stakeholders. This step transforms your data analysis into a powerful strategic tool.
Preview of the Next Lesson:
You have now completed a full unsupervised learning workflow in Alteryx, from data preparation and model building to evaluation and interpretation. In our next module, we will shift gears to focus on a crucial aspect of working with complex workflows: optimization and management. We'll begin by learning how to "Use Performance Profiling to identify and diagnose bottlenecks in a workflow," a fundamental skill for building efficient and scalable Alteryx solutions.