Hello! Welcome back to our series on predictive modeling.
In our last lesson, you successfully built your first binary classification model using the Logistic Regression tool in Alteryx. You learned how to configure the tool with a target variable and predictors to create a model object. Right now, that model is a bit of a "black box"—it takes in data and produces a model, but we don't yet know how it's making its decisions.
Today, we're going to open that box. Our learning outcome is to interpret the model coefficient report and understand odds ratios. By the end of this lesson, you'll be able to look at the summary report generated by the Logistic Regression tool and explain what the model has learned about the relationships between your predictor variables and the outcome you're trying to predict. This is a critical skill for understanding, validating, and explaining your model's behavior.
From Probability to Odds
Before we can understand the model's output, we need to clarify two related but distinct concepts: probability and odds.
- Probability is the likelihood of an event happening, expressed as a number between 0 and 1 (or 0% and 100%). For example, a 70% chance of rain means P(rain) = 0.7.
- Odds are the ratio of the probability of an event happening to the probability of it not happening.
The formula is:
For an event with a 70% probability of success (P=0.7), the probability of failure is 30% (1 - 0.7 = 0.3). The odds would be:
We would say, "The odds of success are 2.33 to 1," or "Success is 2.33 times more likely to happen than to not happen."
To get a clear grasp of this fundamental concept, please watch the following short video clip.
Mastering Odds Ratios in Logistic Regression – A Step-by-Step Guide
The video 'Mastering Odds Ratios in Logistic Regression' by numiqo provides a very clear definition of odds and how they are calculated from probability.
Watch the section from 01:53 to 03:14. This part focuses on defining odds and provides a simple, concrete example to illustrate the calculation.
The Problem with Log-Odds
So why do we need odds? The raw coefficients produced by a logistic regression model are expressed in a unit called log-odds (also known as logits). A log-odd is simply the natural logarithm of the odds.
While mathematically necessary for the model, log-odds are not intuitive for human interpretation. What does it mean if a coefficient is -0.9? How does that translate to a real-world impact? The answer is not obvious.
The next video explains this problem well.
Interpreting Odds Ratios in Logistic Regression
In his video 'Interpreting Odds Ratios in Logistic Regression', the presenter from the Simplistics (QuantPsych) channel explains why the raw coefficients in logistic regression are difficult to interpret directly.
Watch from 11:37 to 13:53. The presenter discusses the raw coefficient from a logistic regression output and highlights why interpreting the 'log of the odds' is not intuitive.
To make these coefficients understandable, we need to convert them from the log-odds scale to a more meaningful scale. We do this by exponentiating the coefficient, which turns the log-odd into an odds ratio.
Understanding Odds Ratios
An odds ratio (OR) is exactly what it sounds like: a ratio of two odds. It compares the odds of an event occurring in one group to the odds of it occurring in another group.
For example, using our Titanic dataset, we might want to compare:
- The odds of survival for female passengers.
- The odds of survival for male passengers.
The odds ratio would tell us how much more or less likely females were to survive compared to males.
- OR > 1: The event is more likely in the first group. (e.g., OR=2 means the odds are twice as high for group 1).
- OR < 1: The event is less likely in the first group. (e.g., OR=0.4 means the odds are 60% lower for group 1).
- OR = 1: The odds are the same for both groups.
The following video clip builds on the concept of odds to introduce odds ratios.
Mastering Odds Ratios in Logistic Regression – A Step-by-Step Guide
Let's return to the numiqo video to see how odds ratios are used to compare two groups.
Watch the section from 03:14 to 06:08. This segment uses a clear medication example to demonstrate the calculation and interpretation of an odds ratio.
The key takeaway is that the Alteryx Logistic Regression tool does the heavy lifting for us. The model coefficients are in log-odds, but the report also gives us the Odds Ratio, which is simply Exp(Coefficient).
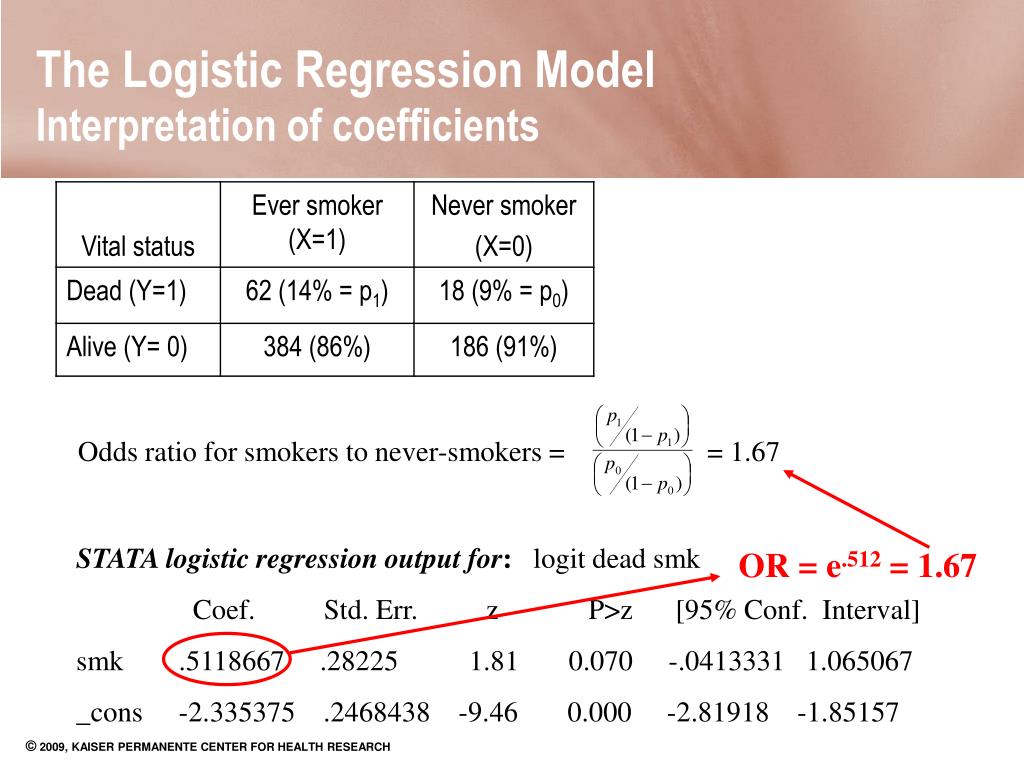
Interpreting the Alteryx Model Report
When you run a Logistic Regression tool in Alteryx, the 'R' output anchor provides a detailed static report. The most important part for our purpose is the Coefficients table.
Let's break down the columns you'll see in that report.

Here's how to interpret the key columns:
- Coefficients: These are the raw log-odds values. As we've discussed, we don't typically interpret these directly.
- Exp(Coeff) / Odds Ratio: This is the most important column for interpretation! Alteryx calculates this by taking
eto the power of the coefficient. - P-value (or
Pr(>|z|)): This tells you if the predictor variable is statistically significant. A small p-value (typically < 0.05) indicates that the variable has a meaningful relationship with the outcome. If the p-value is large, the variable might not be a useful predictor, and the odds ratio associated with it is likely close to 1.
Interpreting Odds Ratios for Different Variable Types
The way you interpret an odds ratio depends on whether the predictor is categorical or continuous.
1. Categorical Predictors (e.g., Sex_female)
The odds ratio compares the odds of the outcome for that category against a "reference" category. In the Titanic dataset, if Sex_male is the reference, the odds ratio for Sex_female would be interpreted as:
"The odds of survival for a female passenger are [OR value] times the odds of survival for a male passenger, holding all other variables constant."
2. Continuous Predictors (e.g., Age)
The odds ratio represents the change in odds for a one-unit increase in the variable. For Age, the interpretation would be:
"For each additional year of age, the odds of survival are multiplied by a factor of [OR value], holding all other variables constant."
If the OR for Age were 0.98, it would mean that for each year older a person is, their odds of surviving decrease by 2% (1 - 0.98).
A Complete Walkthrough
The final video clip ties everything together. It shows a full regression results table and walks through the interpretation of the coefficients and odds ratios for both categorical and continuous variables, reinforcing the concepts we've just covered.
Mastering Odds Ratios in Logistic Regression – A Step-by-Step Guide
This final clip from the numiqo video provides a comprehensive demonstration of how to interpret a full logistic regression results table, connecting all the concepts we've discussed.
Watch from 06:08 to 11:59. Pay close attention to how the presenter interprets the odds ratio for 'medication' (a categorical variable) and 'age' (a continuous variable). Note how they confirm that the odds ratio is simply the exponentiated coefficient.
Conclusion
You have now learned one of the most important skills in classification modeling: interpreting the results. You've moved beyond just building a model to understanding what the model has learned.
Key Takeaways:
- Logistic regression coefficients are in log-odds, which are not directly intuitive.
- To interpret a coefficient, we convert it to an Odds Ratio (OR) by exponentiating it:
OR = e^(coefficient). - An odds ratio tells you how the odds of the outcome change based on a predictor variable.
- For categorical variables, the OR compares the odds of one category to a reference category.
- For continuous variables, the OR represents the multiplicative change in odds for a one-unit increase in the predictor.
- The p-value helps determine if a predictor's effect is statistically significant. A low p-value (< 0.05) suggests the variable is a meaningful contributor to the model.
Preview of the Next Lesson:
Now that you can build a logistic regression model and interpret its results, the next logical step is to use it to make predictions on new data. In our next lesson, we will focus on the learning outcome: "Use the Score tool to generate class probabilities." You'll take the model object (O output) you created and apply it to a dataset to see what it predicts for each record.