Introduction
Hello! Welcome back to our journey through predictive analytics in Alteryx.
In our last lesson, you gained a crucial skill: interpreting the Logistic Regression model's report. You learned how to decipher coefficients and odds ratios to understand how the model makes its decisions by relating predictor variables to the outcome.
Now that we have a trained and understood model, what's next? The goal of building a model is to use it to make predictions on new data. Today, we'll do just that. Our learning outcome is to use the Score tool to generate class probabilities. You'll learn how to take the model object you've built and apply it to a dataset to "score" each record, which, for a classification model, means calculating the probability of it belonging to each class.
From Model to Prediction: The Scoring Process
In predictive modeling, "scoring" is the process of applying a trained model to a dataset to generate predictions. For a classification model, the primary output isn't a simple "yes" or "no" but rather a more nuanced probability.
For instance, with our Titanic dataset, instead of just predicting whether a passenger survived or not, the model will output the probability of survival for that passenger. This probability is a number between 0 and 1. A value of 0.85 means the model is 85% confident that the passenger survived, while a value of 0.10 suggests a very low chance of survival.
In Alteryx, the Score tool is the bridge between your trained model and your prediction data.
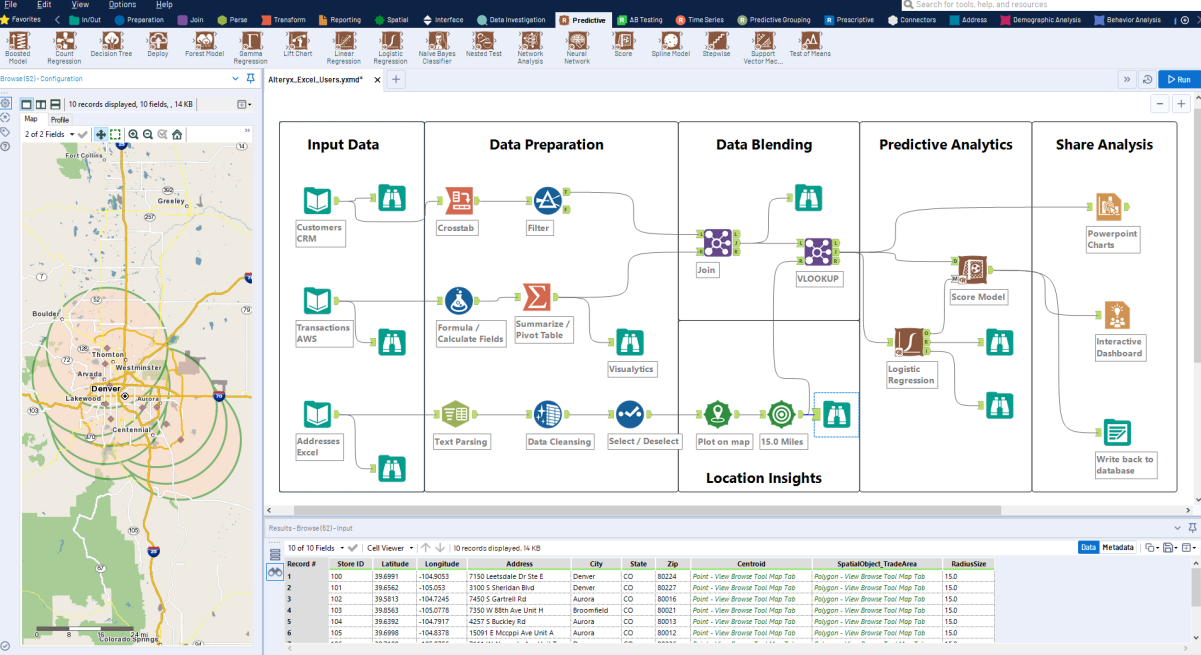
The Score tool requires two inputs:
- (M) input: The model object. This comes from the 'O' (Object) output anchor of a predictive modeling tool, like the
Logistic Regressiontool we used previously. - (D) input: The data you want to score. This dataset must contain the same predictor variables that were used to train the model. This could be a testing set, a validation set, or any new data for which you want to make a prediction.
Configuring the Score Tool
The Score tool itself is straightforward to configure, but it's important to understand its main settings to interpret the output correctly. The official Alteryx documentation provides a good overview.
Score Tool - Designer - Alteryx Help
Let's review the official documentation for the Score tool to understand its purpose and configuration options.
Please read the introduction and the section 'Configure the Tool for Standard Processing'. Pay close attention to the description of the tool's inputs and the main configuration options, especially the one named 'The new field name... or prefix...'.
As you read, the most critical option to understand for our classification model is this:
- The new field name (continuous target) or prefix (categorical target)
Since our logistic regression model has a categorical target (Survived with values 0 and 1), this field will act as a prefix.
Let's say you enter Prob into this configuration box. When you run the workflow, the Score tool will generate new fields by combining this prefix with each possible value of your target variable. In our case, the output data will contain two new fields:
Prob_1: The probability that the passenger survived.Prob_0: The probability that the passenger did not survive.
For any given record (passenger), the values in these two new fields will always add up to 1. Typically, we are most interested in the probability of the "positive" outcome (e.g., Prob_1 for survival).
A Practical Example
Let's see this in the context of a workflow. The following resource provides a simple but effective demonstration of the Score tool being used after a logistic regression model has been built.
Basic Workflow Using Predictive Tools in Alteryx
This blog post from The Data School shows a complete predictive workflow and highlights the use of the Score tool.
Focus on the section titled 'Applying Model to Data'. Observe how the Score tool is used to generate a 'Chance of Survival' field. Note that the Alteryx interface shown in the screenshot is from an older version, so the configuration may look slightly different, but the concept is identical.
After running a workflow with a Score tool, the output data stream will contain all of your original data, with the new probability fields appended at the end.

Your Turn: Applying the Score Tool
Now it's time to connect the concepts. Imagine you have the Alteryx workflow you built in the previous lessons with the Titanic dataset. You've already partitioned the data into training and testing sets and built a logistic regression model on the training data.
Your task is to use that model to predict the survival probability for the passengers in your testing set.
- Drag a Score tool onto the canvas.
- Connect the 'O' output anchor of your
Logistic Regressiontool to the 'M' input anchor of theScoretool. - Connect your testing data stream to the 'D' input anchor of the
Scoretool. - In the
Scoretool's configuration pane, set the prefix for the new field toSurvival_Prob_. - Attach a
Browsetool to the output of theScoretool and run the workflow.
When you examine the results, you should see your original testing data with two new columns: Survival_Prob_1 and Survival_Prob_0. Take a look at the Survival_Prob_1 column. Do the passengers with the highest probability of survival match what you'd expect based on our analysis of the odds ratios in the previous lesson (e.g., female passengers in first class)?
Conclusion
Congratulations! You have successfully used a trained model to make predictions on new data. This is the core purpose of building a predictive model.
Key Takeaways:
- Scoring is the process of applying a trained model to a dataset to generate predictions.
- The Score tool in Alteryx performs this function, taking a model object (M) and a dataset (D) as inputs.
- For a classification model, the Score tool outputs class probabilities—the model's estimated likelihood that a record belongs to each class.
- The output field names are generated by combining a user-defined prefix with the names of the target variable's classes (e.g.,
Prob_1,Prob_0).
Preview of the Next Lesson:
We now have a list of probabilities for each passenger in our test set. But how do we get from a probability like 0.75 to a concrete prediction like "Survived"? And more importantly, how do we measure if those predictions are any good?
In our next lesson, we will address exactly that. We'll learn how to use a cutoff threshold to convert probabilities into classifications and then move on to the crucial topic of model evaluation. Our next learning outcome is to evaluate model performance using a confusion matrix and related metrics (accuracy, precision, recall). This will allow you to quantify your model's performance and determine if it's truly effective.