Hello! Welcome to the ninth module of our course, where we'll be exploring predictive classification models.
In the previous modules, you learned how to build a complete linear regression workflow. You mastered preparing data, training a model to predict a continuous numerical value (like a price or a sales figure), scoring new data, and evaluating the model's accuracy using metrics like RMSE.
Today, we transition from predicting numbers to predicting categories. This is known as classification. Our specific focus will be on the most common type: binary classification, where the outcome has only two possibilities (e.g., Yes/No, True/False, Churn/No Churn).
Our learning outcome for this lesson is to build a logistic regression model for binary classification. You'll learn what logistic regression is, how it differs from linear regression, and how to configure the Logistic Regression tool in Alteryx.
From Linear to Logistic Regression
Let's start by understanding the fundamental difference between the models you've already learned and the one we're covering today.
- Linear Regression predicts a continuous value. For example, "What will be the temperature tomorrow?" The answer could be 25, 25.1, 26.3, or any other number on a scale.
- Logistic Regression predicts the probability of an event occurring, which is then used to classify an outcome into one of two categories. For example, "Will a customer click on an ad?" The answer is either Yes or No. The model calculates the probability of "Yes," and if that probability is above a certain threshold (usually 50%), the prediction is "Yes."
To explore this, we'll use the classic Titanic dataset, where the goal is to predict whether a passenger survived. This is a perfect binary classification problem.
Basic Workflow Using Predictive Tools in Alteryx
The following article, 'Basic Workflow Using Predictive Tools in Alteryx' from The Data School, provides an excellent introduction to this concept using the Titanic dataset. Please read the first two sections.
Please read from the beginning of the article down to (but not including) the sub-heading 'Supervised Learning via Logistic Regression'. Focus on how the author distinguishes between numeric outcomes (requiring linear regression) and classification outcomes (requiring logistic regression).
As the article highlights, because the "Survived" field can only be one of two values, logistic regression is the appropriate tool for the job.
Building a Logistic Regression Model in Alteryx
The process of building a logistic regression model in Alteryx will feel very familiar. It follows the same general pattern as linear regression: you connect your prepared data to a modeling tool and configure it.
Let's look at the basic structure of a logistic regression workflow.
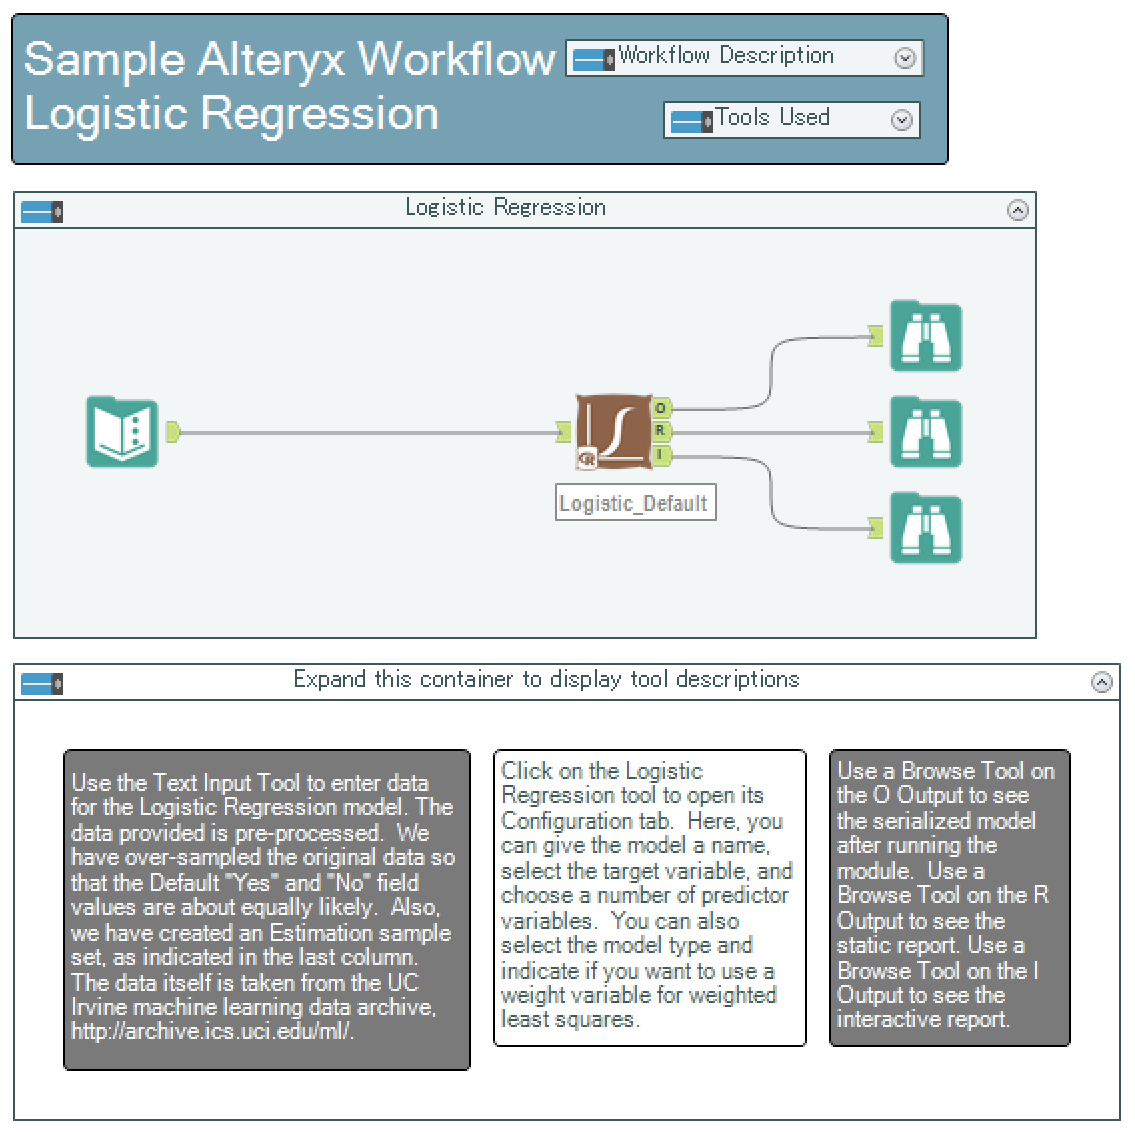
The core of your task is configuring the Logistic Regression tool itself.
Configuring the Logistic Regression Tool
Found in the Predictive tool palette, the Logistic Regression tool has a configuration pane that is very similar to the linear regression tool you've already used.

Let's break down the essential configuration steps shown in the image:
- Model Name: Give your model a unique, descriptive name. As a best practice, avoid spaces or special characters (e.g., use
Titanic_Survival_Modelinstead ofTitanic Survival Model). - Select the target variable: This is the most critical step. You must choose the single field that represents the binary outcome you want to predict. For our example, this would be the
Survivedfield. The model's goal is to predict the value in this column. - Select the predictor variables: Check the boxes for all the fields you want the model to use to make its predictions. These are your independent variables, such as
Pclass(Passenger Class),Sex,Age, andFare.
To see how this tool fits into a slightly more complete workflow, let's return to the article from The Data School.
Basic Workflow Using Predictive Tools in Alteryx
Now, let's see the Logistic Regression tool used in a workflow. Please read the next section of the same article.
Read the section titled 'Supervised Learning via Logistic Regression'. Pay close attention to the screenshot of the workflow and the configuration of the Logistic Regression tool within it. For now, you can ignore the Stepwise tool; we will cover that advanced topic later. Focus on how the data flows into the Logistic Regression tool and what variables are selected.
As you can see, the Logistic Regression tool sits at the heart of the modeling process. You feed it a clean, prepared dataset (from your training sample), and it produces a model object (O output) that is ready for scoring and evaluation.
Understanding the Tool's Outputs
Just like the Linear Regression tool, the Logistic Regression tool produces three outputs:
O(Object): This is the trained model. This output is what you will connect to aScoretool to make predictions on new data, or to aModel Comparisontool to evaluate its performance.R(Report): This is a static, comprehensive report that summarizes the model's findings. It includes a coefficient summary, model fit statistics, and analysis plots.I(Interactive): This provides an interactive dashboard for exploring the model's results.
For the purpose of this lesson—building the model—our primary concern is ensuring the tool is configured correctly to produce the O (Object) output. We will dedicate our entire next lesson to interpreting the R (Report) output.
Conclusion
Congratulations, you have now learned how to build a model for binary classification! You've taken the predictive workflow you learned for regression and successfully adapted it for a new class of problems.
Key Takeaways:
- Classification is a type of predictive modeling used to predict a categorical outcome.
- Binary classification deals with outcomes that have only two possible values (e.g., Yes/No).
- Logistic Regression is the primary technique for building binary classification models. It predicts the probability of an outcome occurring.
- In Alteryx, you use the
Logistic Regressiontool to build the model. The key configuration steps are selecting a single target variable and one or more predictor variables. - The tool's main output is the model object (
O), which can be used for scoring and evaluation.
Preview of the Next Lesson:
Now that you can build a logistic regression model, the next crucial step is to understand what it's telling you. In our next lesson, we will focus on the learning outcome: "Interpret the model coefficient report and understand odds ratios." We will open up that 'R' output report and learn how to decipher what the model has learned about the relationship between variables like passenger class or gender and the likelihood of survival.