Hello! Welcome to your next lesson on predictive modeling in Alteryx.
In our last session, we successfully built our first linear regression model. We saw that after running the workflow, the Linear Regression tool produces a model object (O output) and a report (R output). Building the model is just the first step; the real value comes from understanding what it tells us.
Today, we will dive into that 'R' output. Our goal is to interpret the model summary report, focusing on coefficients, R-Squared, and p-values. By the end of this lesson, you'll be able to look at a model report and answer critical questions about the relationships in your data and the quality of your model.
1. The Anatomy of a Model Report
When you connect a Browse tool to the 'R' output of the Linear Regression tool, Alteryx presents a summary report. This report is your primary tool for evaluating the model. Let's look at a typical example.

The report might seem dense at first, but we're going to break it down into three key areas:
- The Coefficients Table: This section details the relationship between each predictor variable and your target variable.
- R-squared Values: Found at the bottom, these metrics tell you how well your model explains the data.
- P-values: Found within the coefficients table, these tell you if the relationships the model found are statistically significant.
2. R-squared: How Well Does the Model Fit the Data?
The first question you should ask is, "How good is this model at explaining my target variable?" R-squared gives you the answer.
To understand this concept, please watch the following segment from a video that explains regression results.
Interpreting Linear Regression Results
This video, 'Interpreting Linear Regression Results', provides a clear, practical explanation of R-squared.
Watch the segment from 3:27 to 5:43. Focus on how the narrator defines R-squared as the percentage of variance the model can explain.
As the video explains, R-squared (or Multiple R-squared) measures the proportion of the variance in your target variable that can be predicted from the independent variables.
- It ranges from 0 to 1 (or 0% to 100%).
- An R-squared of 0.468 means that your model explains about 46.8% of the variability in the target variable.
- A "good" R-squared value is context-dependent. In some fields, 40-50% is great; in others, you might need 90%+.
However, R-squared has a limitation: it will almost always increase if you add more predictor variables, even if they are useless. This can be misleading. That's why we also have Adjusted R-squared.
An Overview of Stepwise Regression
This Alteryx Community article, 'An Overview of Stepwise Regression', contains an excellent explanation of why Adjusted R-squared is so important.
Read the section starting with 'What is one way we know if our R-squared is being faithful...'. You can stop reading when you get to the part about logistic regressions. Focus on how Adjusted R-squared 'is going to penalize the model for adding additional independent variables that do not add predictive power.'
In short:
- R-squared tells you the proportion of variance explained.
- Adjusted R-squared does the same but accounts for the number of predictors in the model. It penalizes the score for predictors that don't improve the model.
When evaluating your model, you should always look at the Adjusted R-squared as it gives a more honest assessment of your model's predictive power.
3. Coefficients: Describing the Relationships
Coefficients are the core of the model. They describe the magnitude and direction of the relationship between each predictor and the target variable.
Let's look at the Coefficients table in our sample report:
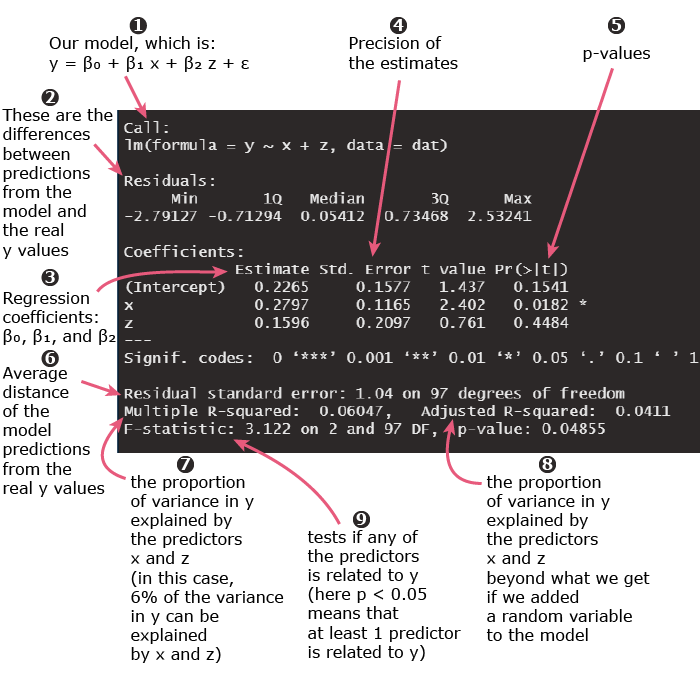
Interpreting the results report of a linear regression
This article from The Data School gives a very clear and concise definition of how to interpret a coefficient's value.
Read the paragraph under the heading 'The coefficients essentially describe the relationship...'. Focus on the example given: 'if the mean years of schooling rose by one year, the urban population is estimated to rise by 1.4 million.'
Here's how to interpret a coefficient:
- Sign (+/-): A positive sign means that as the predictor variable increases, the target variable is predicted to increase. A negative sign means the opposite.
- Magnitude: The number itself tells you how much the target variable is predicted to change for a one-unit increase in the predictor, assuming all other variables are held constant.
For example, in the annotated report image above, the coefficient for wt (weight) is -5.344. This means that for every 1000 lb increase in a car's weight, its mileage (mpg) is predicted to decrease by approximately 5.344 miles per gallon.
The Intercept is the predicted value of the target when all predictor variables are equal to zero.
4. P-values: Are the Relationships Statistically Significant?
Just because a model finds a relationship (a non-zero coefficient) doesn't mean it's a real, reliable relationship. It could have occurred by random chance. The p-value helps us figure this out.
The p-value tests the null hypothesis that the coefficient is actually zero.
- A small p-value (typically ≤ 0.05) suggests that the observed relationship is unlikely to be due to random chance. We can conclude the predictor variable is statistically significant.
- A large p-value (> 0.05) suggests that the relationship could easily be due to chance, and we cannot conclude the variable is significant.
Watch this segment to see this concept explained with an example.
Interpreting Linear Regression Results
Let's return to the 'Interpreting Linear Regression Results' video to understand how to use p-values to check the significance of our coefficients.
Watch the segment from 12:04 to 13:51. The key takeaway is the process of comparing the p-value to a significance level (alpha, usually 0.01, 0.05, or 0.10) to decide if the variable is 'good' or significant.
In the Alteryx report, the p-value is in the column Pr(>|t|). To make it even easier, Alteryx provides significance codes (the stars *** and dots .):
***or**: Very small p-value. Highly significant.*: Small p-value. Significant..: Marginally significant.- (blank): Not significant.
You should generally only trust the interpretation of coefficients that are statistically significant.
5. Putting It All Together: A 4-Step Checklist
Now that we understand the pieces, let's create a simple checklist for interpreting any linear regression report. This checklist is a great way to structure your analysis.
Interpreting Linear Regression Results
The final part of this video provides a fantastic summary of the four key questions to ask when you look at a regression output.
Watch the summary from 13:51 to 16:04. This will tie everything we've learned together into a practical framework.
Here is your interpretation checklist:
-
How well does the model explain the data?
- Look at the Adjusted R-squared. Is it high enough for your purposes?
-
Is the overall model significant?
- Look at the F-statistic's p-value at the bottom of the report. If this p-value is very small (e.g., < 0.05), it means the model as a whole is better than a simple average.
-
Which predictors are significant?
- Look at the
Pr(>|t|)column (the p-values) for each coefficient. - Which ones have p-values ≤ 0.05 (or have stars next to them)? These are your significant predictors.
- Look at the
-
What is the relationship for the significant predictors?
- For each significant predictor, look at its coefficient (Estimate).
- Is the relationship positive or negative? By how much does the target change for a one-unit increase in the predictor? Does this make business sense?
By systematically answering these four questions, you can move from simply looking at a report to truly understanding it.
Conclusion
Great work today! We've unpacked the dense summary report and turned it into a source of valuable insights. You now have a structured way to assess any linear regression model you build.
Key Takeaways:
- Adjusted R-squared tells you the percentage of your target's variation that the model explains, penalizing for unnecessary complexity.
- Coefficients describe the direction (positive/negative) and magnitude of a predictor's relationship with the target.
- P-values test for statistical significance, helping you distinguish real relationships from random chance. A value below 0.05 is the standard threshold for significance.
- Use the 4-step checklist (Model Fit, Overall Significance, Predictor Significance, Relationship Interpretation) to analyze your model's report systematically.
Preview of the Next Lesson:
A model can have great statistics (high R-squared, low p-values) but still be invalid if it violates the core mathematical assumptions of linear regression. In our next lesson, we will describe the key assumptions of linear regression, such as linearity and the normality of residuals, and discuss why they are so important.