Hello! Welcome back to our Alteryx course.
In our last lesson, we established the critical importance of partitioning data into training, validation, and test sets to ensure an unbiased assessment of a model's performance. We learned that the training set is used to "teach" the model.
Today, we're putting that principle into practice. We will build our very first predictive model in Alteryx. Our learning outcome is to build a linear regression model using the Linear Regression tool. We'll focus on the practical steps of finding the tool, configuring it with your data, and understanding the basic structure of a predictive workflow.
1. Introduction to the Linear Regression Tool
Linear regression is a foundational predictive modeling technique. Its goal is to model the linear relationship between a dependent variable (the target you want to predict) and one or more independent variables (the predictors you use to make the prediction). For example, you might try to predict a house's sale price (target) based on its square footage and number of bedrooms (predictors).
In Alteryx, the Linear Regression tool, found in the "Predictive" tool palette, is your primary tool for this task. Let's start by looking at the official documentation to understand its main components.
Linear Regression Tool - Alteryx Help
The Alteryx Help page for the Linear Regression tool provides a great overview of its purpose and configuration options. We'll focus on the standard, most common setup.
Please read the introduction and the first part of the 'Configure the Tool for Standard Processing' section. Specifically, focus on the descriptions for: Model name Select the target variable Select the predictor variables You can skip the parts about regularized regression and cross-validation for now; we'll stick to the basics in this lesson.
As you can see, the basic configuration is straightforward. You give your model a unique name, specify the single field you are trying to predict (the target), and select all the fields you believe might help predict that target (the predictors).
2. Building a Linear Regression Workflow
Now, let's walk through building a complete workflow. A typical predictive workflow in Alteryx involves:
- Inputting your data.
- Preparing the data (cleansing, joining, etc.).
- Partitioning the data into training and testing sets (as we learned in the previous module).
- Building the model using the training set.
The following article from The Data School provides an excellent, practical example of this entire process.
Alteryx Tip #3: Doing linear regressions the easy way!
This blog post, "Alteryx Tip #3: Doing linear regressions the easy way!", demonstrates a real-world scenario of predicting sales. It clearly shows how to connect the tools we've discussed.
First, read the bullet points under 'The Solution' to understand the overall plan. Then, read the section 'Building your regression model and testing its accuracy'. Pay close attention to the screenshots showing the configuration of the Linear Regression tool.
Let's break down the key configuration steps shown in that article. When you add the Linear Regression tool to your canvas and connect it to your training data stream, the configuration pane will look something like this:
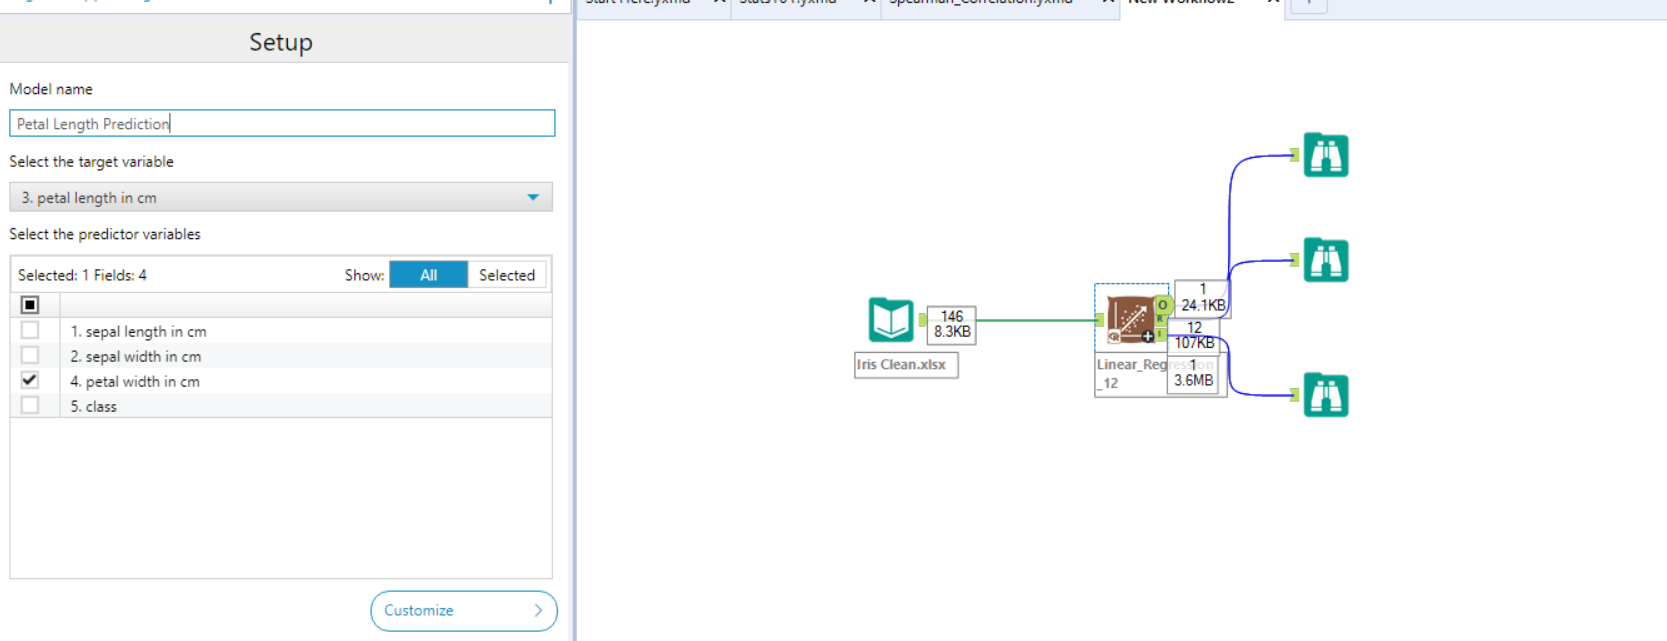
Notice how the workflow is structured:
- The data is first partitioned using the
Create Samplestool. - The E output anchor (Estimation/Training set) of the
Create Samplestool is fed directly into the input of theLinear Regressiontool. This ensures the model is built using only the training data, following the best practices we discussed.
A complete, simple workflow for building the model would look like this:

3. Understanding the Tool's Outputs
Once the workflow runs, the Linear Regression tool produces three distinct outputs, each with a specific purpose. It's important to know what each one is for.
Connect a Browse tool to each of the output anchors to explore the results.

-
O (Output) Anchor: This anchor outputs the model object. It's not human-readable data but rather a package containing the mathematical model itself—the equation, coefficients, and other information Alteryx needs. This object is what you will pass to other predictive tools, like the
Scoretool, to make predictions on new data. -
R (Report) Anchor: This anchor outputs a static report that summarizes the model. It contains tables and plots that help you understand the model's components and its overall performance. This is where you will find key statistics like the R-squared value and the coefficients for your predictor variables.
-
I (Interactive) Anchor: This anchor outputs an interactive dashboard. It allows you to explore the model's results visually, offering more dynamic charts than the static report.
For a quick confirmation of these outputs, you can refer back to the Alteryx Help documentation.
Linear Regression Tool - Alteryx Help
Let's revisit the Alteryx Help document to review the official descriptions of the output anchors.
Please read the short section titled 'View the Output'.
In this lesson, our focus is on successfully building the model. In our next session, we will dive deep into the R (Report) output to learn how to interpret what the model is telling us.
Conclusion
Congratulations! You have now learned how to construct your first predictive model in Alteryx. We've seen how the process directly builds on our previous lessons about data preparation and partitioning, and we've demystified the core components of the Linear Regression tool.
Key Takeaways:
- The Linear Regression tool is used to model the linear relationship between a target variable and one or more predictor variables.
- To build a model, you must configure its name, select one target variable, and choose your predictor variables.
- In a standard predictive workflow, the
Linear Regressiontool is connected to the training data output from aCreate Samplestool. - The tool has three outputs: the model object (O) for scoring, a static report (R) for analysis, and an interactive report (I) for exploration.
Preview of the Next Lesson:
Building a model is only the first step. The real analysis begins when we start to interpret the results. In our next lesson, we will focus on the model report, learning how to interpret the model summary report, focusing on coefficients, R-Squared, and p-values. This will allow us to understand the relationships the model has found and evaluate its quality.