Hello! Welcome to the third lesson in our module on Spatial Data Fundamentals.
In our previous session, we looked at the two main ways to get spatial data into an Alteryx workflow: importing native spatial files like shapefiles and the process of converting coordinate data from a flat file like a CSV.
Today, we will dive deep into that second method. Our focus will be entirely on the tool that makes this conversion possible, a cornerstone of spatial analysis in Alteryx.
Learning Outcome: Create spatial point objects from latitude and longitude data.
By the end of this lesson, you will have a thorough understanding of the Create Points tool—how it works, how to configure it correctly, and its role in turning simple geographic coordinates into powerful spatial objects that Alteryx can use for mapping and analysis.
1. From Coordinates to Spatial Objects
Before we use the tool, let's solidify a key concept. A dataset with Latitude and Longitude columns contains numbers, but to Alteryx's spatial toolset, these are just separate numeric fields. They don't inherently represent a location on a map.
The purpose of the Create Points tool is to take these two numeric values from each row and combine them into a single, special data type called a Spatial Object (SpatialObj). This object is a packaged piece of information that Alteryx recognizes as a geographic point, enabling it to be mapped, measured, and analyzed in relation to other spatial objects.
2. The Create Points Tool: A Step-by-Step Guide
The process of creating points is straightforward and builds on practices we've already discussed. Let's break it down.
Step 1: Ensure Correct Data Types (A Quick Recap)
As we covered in the last lesson, the Create Points tool requires numeric input. When you import data from text-based files like CSVs, Alteryx might read your coordinate fields as strings.
Best Practice: Always place a Select tool after your input data and verify that your latitude and longitude columns are set to a numeric type, preferably Double, to handle decimal values.
Step 2: Configure the Create Points Tool
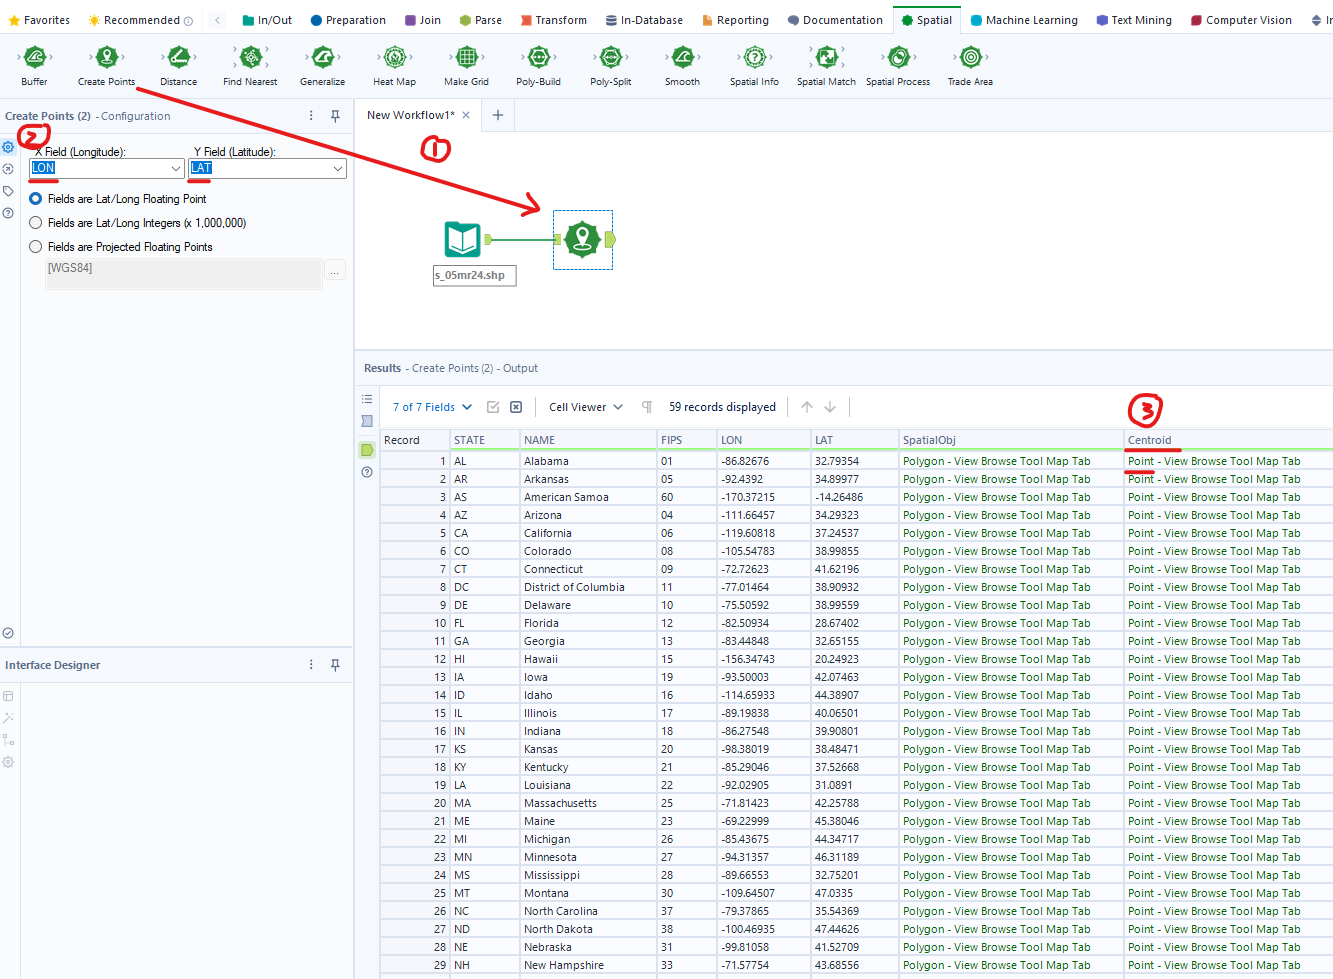
With your data correctly formatted, you can now add the Create Points tool, found in the Spatial tool palette. Its configuration is simple but critical.

Let's look at the key options in this window:
-
X Field (Longitude) and Y Field (Latitude): This is where you tell Alteryx which columns contain your coordinate data.
- X Field always corresponds to Longitude (East/West position).
- Y Field always corresponds to Latitude (North/South position).
- Alteryx is often smart enough to automatically select columns named "Latitude," "Longitude," "Lat," or "Lon." However, you should always verify these selections are correct.
-
Coordinate Format Radio Buttons: These buttons tell Alteryx what kind of numbers to expect.
- Fields are Lat/Long Floating Point: This is the most common and default setting. It's used when your coordinates are in decimal degrees (e.g., 51.5072, -0.1276).
- Fields are Lat/Long Integers (x 1,000,000): Use this if your coordinates are stored as integers to preserve precision (e.g.,
51507200instead of51.5072). The tool will correctly divide by 1,000,000 to interpret the value. - Fields are Projected Floating Points: This is for more advanced use cases involving different coordinate systems and is not typically required for standard lat/lon data.
For the certification and most common business scenarios, you will almost always use "Fields are Lat/Long Floating Point."
To see this process described in a practical example, please review the following guide.
Spatial Tools in Alteryx: Part 1 - The Data School
The following article from The Data School demonstrates the standard workflow for creating points. It reinforces the importance of checking data types before using the Create Points tool.
Please read 'Step 2: Check Your Latitude and Longitude Data Types' and 'Step 3: Create Spatial Points Using the Create Points Tool'. Focus on how the Select tool is used first, and then how the latitude and longitude fields are mapped within the Create Points tool configuration.
Step 3: The Output
After running the workflow, the Create Points tool adds a new column to your dataset. By default, this column is named Centroid. It contains the newly generated SpatialObj point for each row. In the Results window, you will see the data in this column is green, indicating it's a spatial data type.
3. Verifying Your Spatial Points
You've created the points, but how do you know they're correct? The best way is to visualize them. The Browse tool is essential for this.
When you attach a Browse tool to the output of the Create Points tool and run the workflow, the Browse tool's configuration pane will display your data. By selecting the Map tab, you can see your points plotted on an interactive map. This is an immediate and effective way to validate that your coordinates have been interpreted correctly.
Spatial Tools in Alteryx: Part 1 - The Data School
Let's revisit the previous article to see how the Browse tool is used for verification.
Now, read 'Step 4: Explore Your Spatial Data with the Browse Tool'. This shows how to visualize the points you've just created.
4. Hands-On Practice
Let's put this into practice. We'll use the same simple dataset from our last lesson, but this time, focus entirely on the configuration of the Create Points tool.
- Open a new Alteryx workflow.
- Drag a Text Input tool onto the canvas. Create three columns:
City,Latitude, andLongitude. Enter the following data:
| City | Latitude | Longitude |
|---|---|---|
| London | 51.5072 | -0.1276 |
| Paris | 48.8566 | 2.3522 |
| New York | 40.7128 | -74.0060 |
- Add a Select tool. Ensure
LatitudeandLongitudeare set to theDoubledata type. - From the Spatial tool palette, add a Create Points tool.
- In the configuration window, check that the X Field is
Longitudeand the Y Field isLatitude. - Ensure the "Fields are Lat/Long Floating Point" radio button is selected.
- In the configuration window, check that the X Field is
- Add a Browse tool after the Create Points tool and run the workflow.
Click on the Browse tool and select its Map tab. You should see three points correctly plotted on the world map, confirming you have successfully created spatial point objects.
Conclusion
Today, we've focused on one of the most fundamental tools in Alteryx's spatial toolkit. By converting latitude and longitude coordinates into spatial point objects, you unlock the ability to perform a vast range of geographic analyses.
Key Takeaways:
- The Create Points tool is used to convert separate latitude and longitude fields into a single Spatial Object field.
- The standard convention is X = Longitude and Y = Latitude.
- It is critical to ensure your coordinate fields are a numeric data type (like
Double) before using the tool. - The most common configuration uses the "Lat/Long Floating Point" setting for decimal degrees.
- Always use the Browse tool to visualize your created points on a map for verification.
In this lesson, we used the Browse tool for a quick check. In our next session, we'll take a much closer look at this powerful tool and learn how to use the Browse tool to visualize spatial objects and layers on a map, customize base maps, and display multiple datasets at once.