Hello! Welcome to the first lesson in our module on Applied Spatial Analytics.
In the previous module, we built a solid foundation in spatial data. We learned how to create spatial points, visualize them, and in our last lesson, you mastered the Distance tool to calculate straight-line and drive-time distances between objects.
Now, we're going to take that concept of "drive time" and give it a powerful visual form. Instead of just calculating a single number representing the time between two points, what if we could draw a shape on a map that shows all the areas you can reach within a given time? That's precisely what a trade area does.
Learning Outcome: Create drive-time polygons and other trade areas using the Trade Area tool.
Today, we'll dive into the Trade Area tool, one of the most frequently used tools in business-focused spatial analysis. You'll learn how to create simple radius-based circles and more sophisticated, realistic drive-time polygons that follow the road network.
1. Understanding Trade Areas
A trade area (also known as a catchment area or service area) is a geographic boundary that represents the market reach of a location. In Alteryx, the Trade Area tool creates a polygon spatial object around a point object. These polygons are essential for a wide range of business analyses, from site selection ("Which proposed location has more households within a 10-minute drive?") to marketing ("Which customers should we send this flyer to?").
There are two primary types of trade areas you will create:
- Radius-based: A simple circle ("as the crow flies") drawn around a point. This is quick and useful for high-level analysis or in areas where travel is uniform. You can also create concentric rings or bands.
- Drivetime-based: A more realistic polygon whose shape is determined by how far you can travel on a road network within a specified time. This is the gold standard for most urban and suburban business analysis.
To see this tool in a practical context, let's explore a case study.
Alteryx Designer: An Introduction to Spatial Analytics
This article from Billigence walks through a business problem: calculating customer density around a store. It provides an excellent demonstration of why and how you would use the Trade Area tool as a first step.
First, read the 'Introduction to Spatial Tools - Case Study Example' section to understand the business problem. Then, skip down to the 'Trade Area Tool' section to see how it's configured to solve the first task. Pay close attention to how a simple text string, '0-5, 5-8', is used to create both a circle (0-5 miles) and a concentric ring or 'band' (5-8 miles).
As the article demonstrates, the Trade Area tool is straightforward but powerful. It takes a point (the store) and generates polygons (the market areas) that can be used for further analysis.
2. Configuring the Trade Area Tool
Let's take a closer look at the tool's configuration panel to understand all the options at your disposal.
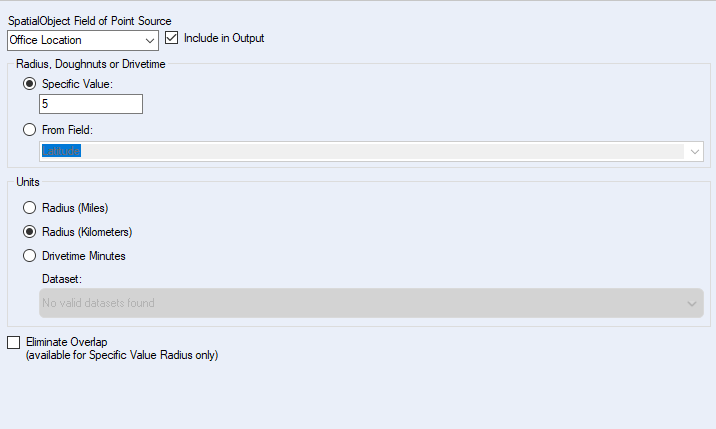
This panel has a few key settings:
-
SpatialObject Field of Point Source: Select the field from your data stream that contains the point object(s) you want to build trade areas around.
-
Radius / Drivetime Specification:
- Specific Value: You type the value(s) directly into the box. This is what you saw in the Billigence article. You can enter a single value (
10), or a comma-separated list to create concentric zones (5,10,15). You can also create rings/bands like0-5,5-8. - From Field: This is a more dynamic option. Imagine you have a dataset of stores where large-format stores get a 15-minute drivetime area and smaller express stores get a 5-minute one. You could have a field in your data specifying this value for each store, and the tool will use it to generate the appropriately-sized polygon for each record.
- Specific Value: You type the value(s) directly into the box. This is what you saw in the Billigence article. You can enter a single value (
-
Units:
- Radius (Miles/Kilometers): Creates simple circular trade areas.
- Drivetime Minutes: Creates polygons based on the road network. Note: This functionality requires that you have an Alteryx spatial data package (like TomTom or HERE) installed and licensed, which provides the underlying street map data for the calculation.
-
Eliminate Overlap: If you are creating trade areas for multiple points that are close to each other, their polygons might overlap. This option intelligently assigns the overlapping area to the closest point source, creating clean, non-overlapping boundaries. This is extremely useful for defining distinct sales territories.

3. Hands-On Practice
It's time to build a workflow and create some trade areas yourself.
Scenario: You are an analyst for a retail chain. You have the location of a potential new store in Manhattan and need to visualize its market reach using both a simple radius and a more realistic drivetime.
- Open a new Alteryx workflow.
- Use a Text Input tool and enter the data for one store:
| StoreName | Latitude | Longitude |
|---|---|---|
| Midtown Store | 40.7484 | -73.9857 |
-
Add a Create Points tool. Configure it to create a spatial object from the
Longitude(X Field) andLatitude(Y Field). -
Now, let's create the radius-based trade areas. Drag a Trade Area tool onto the canvas and connect it to the output of the
Create Pointstool.- In the configuration panel, for Specific Value, enter
0-1,1-3. This will create a 1-mile inner circle and a band from 1 to 3 miles. - Ensure the Units are set to
Radius (Miles). - Add a Browse tool after this
Trade Areatool.
- In the configuration panel, for Specific Value, enter
-
Next, let's create the drivetime-based trade area. Drag a second Trade Area tool onto the canvas and connect it to the same
Create Pointstool output.- In the configuration panel, for Specific Value, enter
5. - Change the Units to
Drivetime Minutes. - Add another Browse tool after this second
Trade Areatool.
- In the configuration panel, for Specific Value, enter
-
Run the workflow. Click on each
Browsetool to see the results.- The first
Browsewill show two concentric polygons: a circle and a ring. - The second
Browsewill show a single, irregularly shaped polygon that follows the street network of Manhattan. Notice how it stretches further along avenues (north-south) than across streets (east-west), reflecting the real-world traffic patterns.
- The first
This simple workflow clearly illustrates the difference between the two main types of trade areas and how to generate them.
4. What's Next for Trade Areas?
Creating a trade area polygon is powerful, but it's typically just the first step in a larger analysis. The real value comes when you use that polygon to understand what's inside it. The next logical question is always, "Now that I have this 5-minute drivetime zone, how many of my customers live there?" or "Which competing stores fall within my 1-mile radius?"
Answering these questions involves overlaying one set of spatial objects (like customer points) with another (like your trade area polygon). This is a process called spatial matching. If you look back at the articles from Billigence or The Data School, you'll see that the very next tool they use after Trade Area is Spatial Match.
Conclusion
In this lesson, you've added a crucial tool to your spatial analytics toolkit. The Trade Area tool moves beyond simple distance measurement and allows you to visualize and define market boundaries, which is a cornerstone of applied spatial analysis.
Key Takeaways:
- The Trade Area tool creates polygon spatial objects around points.
- You can create simple radius-based circles and rings, which are great for quick estimates.
- You can also create more realistic drivetime-based polygons that follow the road network, which is essential for most business use cases.
- The tool can be configured using specific values or dynamically using values from a field in your data.
- Creating a trade area is often the first step before using other tools to analyze what falls inside that area.
Preview of the Next Lesson:
We've set the stage perfectly for our next topic. Now that we know how to create these "container" polygons, we need to learn how to find out what's inside them. In the next lesson, we will master the Spatial Match tool to identify relationships between different sets of spatial objects, such as finding all the customers within a store's trade area.