Introduction
Welcome back! In our last lesson, you designed the information architecture and visual layout for an executive transformation dashboard. We focused on the "what" and "why" of data presentation—structuring the dashboard around an executive's needs and using visual storytelling to communicate insights effectively. You now have a solid blueprint for what the end product should look like.
Today, we transition from design to implementation planning. A beautiful dashboard is useless without reliable, automated data feeding it. This lesson addresses the critical next step, focusing on the learning outcome: Plan the integration of transformation tracking tools into existing organizational workflows.
We will explore how to make your dashboard a living, automated system by:
- Defining a holistic integration strategy that goes beyond just technical connections.
- Identifying data sources and designing the workflows that capture the necessary information without overburdening your teams.
- Creating a phased integration roadmap to manage complexity and build momentum.
- Planning for the human side of integration, ensuring the tools themselves are adopted and embedded into daily operations.
Your background in project and product management is directly applicable here. You'll be approaching this not as a developer writing integration code, but as a strategist designing a system of systems—connecting technology, processes, and people to generate value.
1. Broadening the Scope: An Integration Plan is a Project Plan
When we hear "integration," it's easy to jump to technical solutions like APIs. However, integrating a suite of transformation tracking tools is a significant project in itself. A narrow, tech-only focus is a common reason why such initiatives fail to deliver value.
To set the right strategic frame, let's look at the common pitfalls of planning large-scale technology implementations.
How to Estimate Your ERP / HCM Implementation Time, Duration, and Project Plan
This video, 'How to Estimate Your ERP / HCM Implementation Time,' by Eric Kimberling, though focused on ERPs, provides crucial insights into why initial project plans are often unrealistic. Its lessons are directly transferable to planning the integration of your transformation tech stack.
Please watch the section from (12:30) to (18:10). As you watch, focus on the 'missing scope' items the speaker identifies, such as organizational change management (OCM), data migration, and program management. Think about how each of these applies to integrating your tracking tools.
As the video highlights, a robust plan must account for activities that vendors or IT teams might not include in their scope. For your transformation tracking stack, this means your integration plan must explicitly include:
- Organizational Change Management (OCM): How will you train people to use the new tools (like a Digital Adoption Platform or sentiment analysis tool)? How will you communicate the purpose of the data collection to build trust?
- Data Migration & Cleansing: The data from your source systems (Jira, HRIS, etc.) may not be clean or in the right format. Who is responsible for ensuring data quality before it's fed into the dashboard?
- Program Management & Governance: Who owns the integration project? Who has decision rights? Who is responsible for maintaining the integrations once they are live?
- Process Redesign: How will existing workflows (e.g., team stand-ups, manager 1-on-1s) change to incorporate insights from the new tools?
By thinking about integration as a comprehensive project from the start, you avoid downstream surprises and set realistic expectations for the effort required.
2. The Integration Model: Federated Tools, Centralized Insight
A key challenge in a large B2B software company is that different teams work in different systems. Engineering lives in Jira and GitHub, Sales in a CRM, and Customer Success in a support platform. Forcing everyone onto a single new platform to track transformation progress is a non-starter.
The modern approach is a federated model: allow teams to continue working in their preferred tools while integrating the data from those tools into a central change management or analytics platform.
This video from ServiceNow explains the concept perfectly in the context of modernizing IT change management, but the principles are universal for any transformation.
In 'Modernizing Change Management,' the speaker describes how to handle the increasing volume and velocity of change by moving away from a monolithic process to a more flexible, integrated model. This is a powerful analogy for our work.
Please watch two key segments: Introduction to the Model (09:51 - 12:02): This section introduces the core idea of using 'change models' to decouple processes and integrate data from various resident tools into a central platform for visibility and automation. DevOps Integration Example (32:48 - 35:39): This provides a concrete example of how data from developer platforms (like Jira or Azure DevOps) is automatically pulled into ServiceNow to create and manage change records. This is a perfect illustration of the federated model in action.
The key takeaway is that integration should meet people where they are. Your plan shouldn't be to replace Jira; it should be to pull relevant data from Jira (like cycle time, story points, or defect rates) and correlate it with data from other systems in your central dashboard.
This "pull" can happen in several ways:
- Direct API Integrations: For real-time data from modern, cloud-based tools.
- Middleware/ETL Tools: To connect systems, transform data, and load it into a data warehouse or your dashboarding tool.
- Central Platforms (like ServiceNow): These often come with pre-built connectors to common enterprise systems.
Your role as the transformation leader is to identify the critical data points needed for your dashboard and then work with IT and data teams to architect the flows, using the path of least resistance.
3. Planning the Integration Workflow: A Phased Approach
With a federated model in mind, you can create a detailed integration plan. This involves mapping data sources to your dashboard KPIs and defining a phased rollout.
Step 1: Map Data Sources to Dashboard KPIs
For each metric on the executive dashboard you designed, you need to identify its source system.
| Dashboard KPI (from previous lesson) | Potential Data Source(s) | Integration Method |
|---|---|---|
| AI Tool Adoption Rate | Digital Adoption Platform (DAP) logs, SSO provider (e.g., Okta) logs | Direct API or data export |
| Productivity Delta (Cycle Time) | Jira, Azure DevOps | API Integration |
| Employee Sentiment Score | Survey tools (e.g., SurveyMonkey), NLP analysis of Slack/Teams channels | API or Manual Export |
| Transformation ROI | Finance system (for costs), Business Intelligence (BI) tool (for revenue/savings) | Manual entry + API |
| Training Completion Rate | Learning Management System (LMS) | API or Scheduled Report |
Step 2: Design the Integration of New Tools
You will likely introduce new tools, such as DAPs or sentiment analysis platforms. The integration plan must detail how these tools become part of the daily workflow.
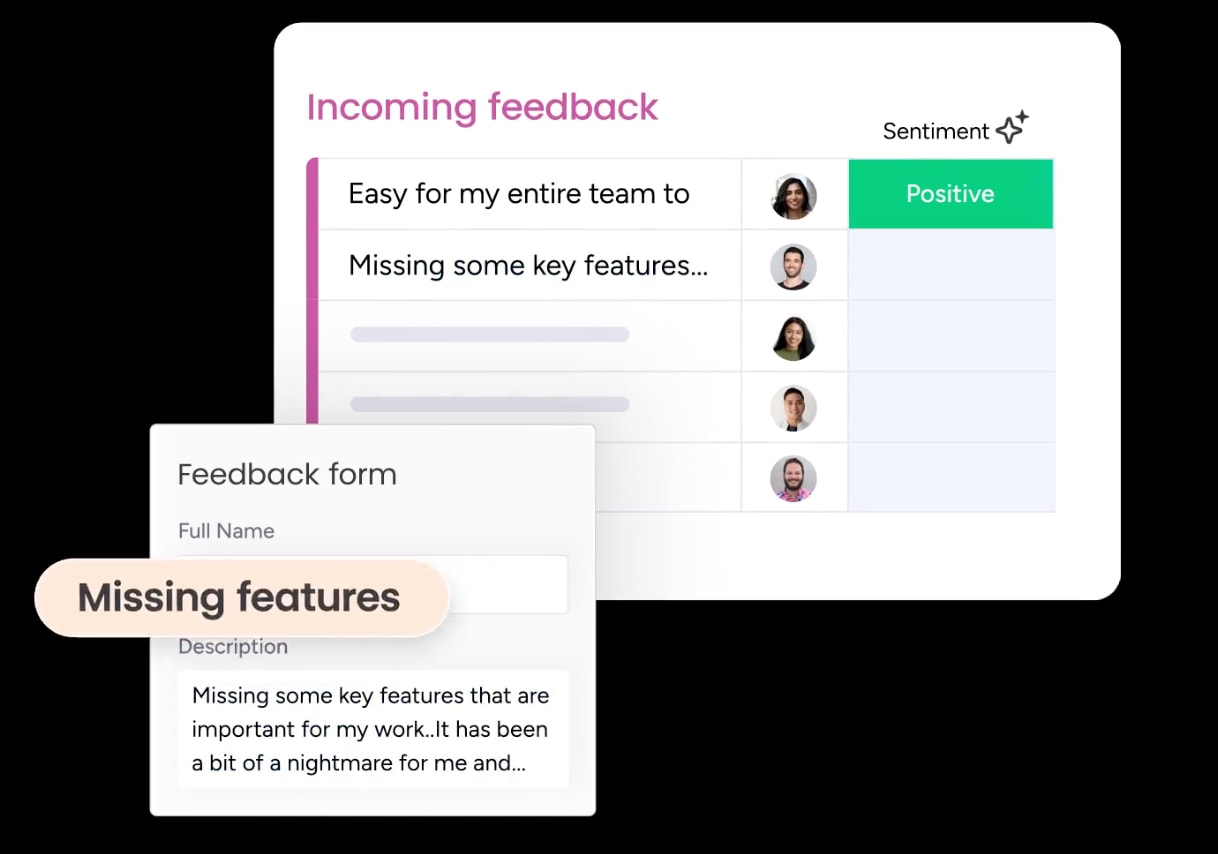
The goal is to capture data passively or with minimal effort. For example, a feedback tool can be embedded directly into an application, allowing users to provide sentiment in the moment.
Step 3: Create a Phased Integration Roadmap
You cannot integrate everything at once. A phased roadmap allows you to show value quickly, learn from experience, and manage risk. This aligns with the "Adoption Journey" concept.
Let's revisit the ServiceNow video to see how they structure this journey. This provides an excellent template for your own integration roadmap.
Watch the section on the 'Adoption Journey' from (39:15) to (41:59). Notice the progression: start by experimenting with new models for a small group, then scale by leveraging data and automation. This is a maturity model for integration.
Your roadmap can be structured in a similar way:
- Phase 0: Manual & Foundational (Weeks 1-4)
- Goal: Get the dashboard live with manually exported data to validate its design and utility with executives.
- Activities:
- Manually pull reports from Jira, your LMS, and finance systems.
- Run a baseline sentiment survey.
- Finalize dashboard KPIs and layout based on initial feedback.
- Phase 1: Pilot Automation (Weeks 5-12)
- Goal: Automate the data flow for 1-2 key metrics for a single pilot team or business unit.
- Activities:
- Implement the Jira API connection to track cycle time for the pilot "Platform" team.
- Roll out a DAP to this team to track adoption of a new internal tool.
- Refine integration processes based on pilot team feedback.
- Phase 2: Scale & Expand (Weeks 13-24)
- Goal: Roll out automated data collection enterprise-wide.
- Activities:
- Expand API integrations to all engineering teams.
- Integrate DAP across the entire organization.
- Set up automated sentiment analysis on public Slack channels.
- Phase 3: Optimize & Embed (Ongoing)
- Goal: Use the integrated data to drive decisions and embed insights into business-as-usual (BAU) processes.
- Activities:
- Train managers on how to interpret dashboard data in their 1-on-1s.
- Integrate dashboard alerts with team communication channels.
4. Application Exercise: Draft an Integration Plan
Let's make this practical. Your task is to create a high-level integration plan for a single, crucial element of your transformation: tracking the adoption and impact of AI tools.
Drawing on the concepts we've discussed, create a document that contains the following three sections:
- KPI & Data Source Mapping: List at least three KPIs for tracking AI tool adoption/impact (you can use metrics from our previous lessons). For each KPI, identify the likely source system(s).
- Workflow Integration Description: For one of your KPIs, describe how the data collection will be integrated into an employee's workflow. Will it be passive (e.g., system logs)? Will it require active input (e.g., filling out a form)? How will you make it seamless?
- Phased Integration Roadmap: Create a simple 3-phase roadmap (Pilot, Scale, Embed) for implementing the tracking for these KPIs. For each phase, list 1-2 key activities.
This exercise will produce a tangible artifact that you can adapt for your real-world transformation program.
5. Governing the System: Embedding Integration into BAU
Once the technical integrations are live, the work shifts to process and governance. Without this, you have a fancy dashboard that nobody uses. The goal is to embed the tools and their outputs into the organization's operating rhythm.
How to Do Change Management for Software, Systems, Technology ...
The article 'How to Do Change Management for Software...' provides an excellent framework for ensuring technology adoption sticks. We'll focus on the final phase, which is all about making the new system part of Business as Usual.
Please read the section titled 'Embed Change into Business as Usual Operations.' Focus on the concrete actions described, such as transitioning accountability, establishing a council, and maintaining documentation.
To ensure your transformation tracking stack is sustainable, your plan must define:
- Ownership (RACI): Who is Responsible, Accountable, Consulted, and Informed for the tracking tools and the dashboard? Who is the business owner of the sentiment analysis tool? Who is accountable for the data quality from Jira?
- Operating Cadence: How and when will the data be reviewed? (e.g., a standing agenda item in the weekly Transformation Steering Committee).
- Maintenance & Enhancement: Who triages when an integration breaks? How are new metrics or data sources requested and prioritized? This might be managed by a Transformation Management Office (TMO) or a dedicated data/ops team.
This governance layer is what makes the integration strategic, transforming it from a one-time technical setup into a continuous capability for the organization.
Conclusion
In this lesson, we've outlined a comprehensive approach to planning the integration of your transformation tracking tools. You've learned that a successful plan is a strategic project in itself, encompassing technology, process, and people.
Key Takeaways:
- Think Holistically: An integration plan must include OCM, data governance, and program management, not just technical tasks.
- Use a Federated Model: Integrate data from the tools your teams already use rather than forcing them onto a new platform. Meet them where they work.
- Roll Out in Phases: Use a roadmap that starts with manual data to validate your approach, pilots automation with a small group, and then scales across the organization.
- Govern for Sustainability: The ultimate goal is to embed the tools and their insights into your company's daily operations by defining clear ownership and review cadences.
Preview of the Next Lesson
You have now designed a dashboard and planned how to get real-time data flowing into it. The system is ready. The next critical question is: what do you do with the information? A dashboard that isn't used to make decisions is just expensive wallpaper.
In our next and final lesson of this module, we will address the learning outcome: "Interpret real-time adoption data to make evidence-based transformation decisions." We will explore frameworks and techniques for turning data into action, closing the loop on our transformation tech stack.