Introduction
Welcome to the next lesson in our module on the Transformation Tech Stack. In our previous session, we established what to measure by defining key metrics across adoption, productivity, financials, and risk. We also explored how AI can generate narrative-driven insights, moving beyond simple data points.
Now, we shift our focus from the "what" to the "how." A collection of brilliant metrics is useless if it's presented in a confusing or overwhelming way. This is particularly true for your primary audience: executive stakeholders, who are time-poor and need to grasp the strategic picture in seconds.
This lesson is designed to help you master the following learning outcome: Design the information architecture and visual layout of a transformation dashboard for executive stakeholders.
We will cover:
- Information Architecture: How to structure your dashboard so it aligns with how executives think.
- Visual Design Principles: How to choose visualizations that communicate with clarity and impact.
- Data Storytelling: How to frame your data to tell a compelling story of progress, challenges, and decisions.
Your background in product management is highly relevant here. Designing a dashboard is like designing a product for a specific user. Your goal is not just to display data, but to create an experience that leads to faster, smarter decisions.
1. Information Architecture: The Blueprint for Clarity
Before a single chart is created, you must decide how to organize the information. A strong information architecture ensures that executives can find what they need, understand its context, and not get lost in irrelevant details.
The first step is to understand the unique purpose and audience of an executive dashboard.
Executive dashboards: Definition, examples, and design guide
The article 'Executive dashboards: Definition, examples, and design guide' from ThoughtSpot provides a clear distinction between executive, tactical, and operational dashboards. It also introduces a powerful model for structuring the information.
Please read the first two main sections of the article: Start with 'What is an executive dashboard?' and continue through to 'Where executive dashboards fit among other examples of dashboards.' Then, read the section titled 'The Executive Command Center model: 3 views every executive dashboard needs.' Focus on the differences in scope and audience, and the purpose of the three proposed views.
As the article highlights, the key is to zoom out from operational details to strategic KPIs. The Executive Command Center model is an excellent framework for your transformation dashboard's information architecture. It organizes metrics into three intuitive views:
- View 1 – Performance: "Are we on track?"
- This view shows lagging indicators that confirm results. For your transformation, this is where you'd track metrics like Productivity Delta or ROI by Business Unit. It answers whether the changes are delivering the promised value.
- View 2 – Pipeline: "What's coming next?"
- This shows leading indicators that predict future outcomes. For a transformation, this isn't just about sales. It's about the pipeline of change itself. Metrics like AI Tool Adoption Rate or Training Completion Rate fit here, as they predict future productivity gains.
- View 3 – Health & Risk: "Where are we drifting off course?"
- This view surfaces early warnings. It's the home for metrics like Security Incident Rate, Compliance Adherence Score, or even negative sentiment trends from your analysis tools. It helps you proactively manage the downsides of the transformation.
This structure provides a comprehensive, at-a-glance story of your program's health.
2. Visual Design: From Data to Insight in 30 Seconds
With a solid information architecture, the next step is visual design. The goal is to make the dashboard scannable, allowing an executive to absorb the most critical information in under 30 seconds. This requires discipline and a focus on clarity over decoration.
This video provides an excellent summary of key principles for effective dashboard design.
12 Dashboard design tips for better data visualization
The video '12 Dashboard design tips for better data visualization' by Geckoboard offers practical, easy-to-implement advice for creating clean and effective dashboards.
Watch the video from (00:49) to (07:21), and then the final tip at (08:21) to (08:42). Pay close attention to these core ideas: Know your audience and be selective with data. Reduce 'non-data ink' to minimize visual noise. Choose the right visualization for the job. Group related metrics and use visual hierarchy (e.g., top-left for most important). Provide context to numbers (e.g., comparisons, targets). The importance of iteration and feedback.
Let's summarize the most critical points for an executive transformation dashboard:
- Less is More: An executive dashboard is not a data exploration tool. Every element must earn its place. Ruthlessly eliminate anything that doesn't contribute to a key insight (the "data-ink ratio").
- Hierarchy is Everything: Place the single most important KPI (e.g., Overall Transformation ROI) in the top-left corner, making it large and prominent. Use size and position to guide the viewer's eye.
- Context is King: A number like "35% adoption" is meaningless alone. It needs context: Is it up from 20% last month? Is the target 80%? Use sparklines, comparison values, or color-coded indicators (sparingly!) to show whether a number is good, bad, or neutral.
- Choose Clarity Over Coolness: Stick to simple, familiar chart types.
- Big Number with Trend: For headline KPIs.
- Bar/Column Charts: For comparing quantities across categories (e.g., adoption by department).
- Line Charts: For showing trends over time (e.g., productivity delta over 6 months).
- Gauges/Progress Bars: For showing progress toward a specific target.
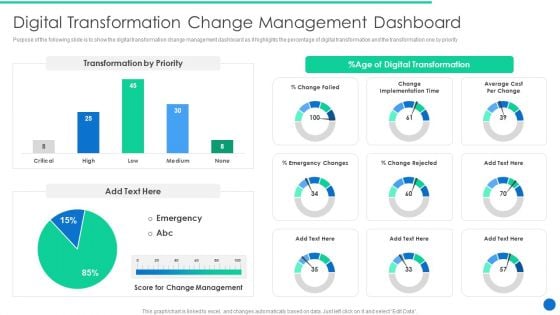
This image of a change management dashboard shows some of these principles in action, such as using gauges for progress and bar charts for comparisons.
3. Application Exercise: Tailoring the Dashboard to Your Stakeholders
Different executives care about different facets of the transformation. The CFO is focused on ROI, while the CTO is concerned with technical risks and delivery velocity. Your dashboard architecture must reflect this.
In the previous lesson, we used the Worklytics article "12 Metrics Every C-Suite Needs on Employee AI Usage." Now, let's revisit a specific section of that resource to help with this tailoring.
12 Metrics Every C-Suite Needs on Employee AI Usage
Let's revisit the Worklytics article. This time, we'll focus on its template for dashboard structure and how it aligns KPIs with specific executive roles.
Please read the section titled 'Executive Dashboard Template: Structure and Implementation'. Pay close attention to the table under 'Dashboard Layout and Visualization' and the bullet points under 'Key Performance Indicators by Executive Role'.
Task:
Using the Executive Command Center model (Performance, Pipeline, Health & Risk) as your structure, identify the single most important metric for both the CEO and the CFO in each of the three views. You can pull these from the Worklytics article or define your own.
Fill out a simple table like the one below. This exercise will help you practice designing role-specific dashboard views.
| Command Center View | Most Important Metric for CEO | Most Important Metric for CFO |
|---|---|---|
| Performance | ||
| Pipeline | ||
| Health & Risk |
4. Beyond Display: Telling a Story with Data
A great dashboard doesn't just present data; it tells a story. This aligns with your goal of crafting a compelling change narrative. By structuring your data visuals using a narrative framework, you can guide executives to the right conclusions and prompt them to action.
A simple yet powerful narrative structure is: Setup, Conflict, Resolution.
Telling Stories with Data in 3 Steps (Quick Study)
This short video from Harvard Business Review, 'Telling Stories with Data in 3 Steps,' explains the universal narrative structure and how to apply it to data visualization to create an emotional connection and drive your message home.
Please watch the entire video. It's short and impactful. Focus on how the presenter deconstructs a complex chart to find a story, and then redesigns the visualization to tell that story clearly.
Here is how you can apply the Setup, Conflict, Resolution framework to your transformation dashboard:
- Setup (The Plan): This is the baseline, the target, or the expectation. Visually, this could be a target line on a chart or a stated goal in a title.
- Example: A line chart title reads, "Goal: Reduce deployment time to <24 hours." The target line is drawn at 24 hours.
- Conflict (The Reality): This is what the data is actually showing—the gap, the unexpected trend, the problem. This is the most prominent part of your visualization.
- Example: The line chart shows the actual deployment time hovering at 72 hours, far above the target line.
- Resolution (The Insight): This is the "so what?"—the reason for the conflict or the recommended next step. This is where the AI-driven narrative insights we discussed in the last lesson become invaluable.
- Example: A text box next to the chart, generated by your monitoring system, states: "Deployment times are 3x target due to integration testing failures in the 'Billing' microservice. Recommendation: Prioritize technical support for the Billing team."
This narrative approach transforms your dashboard from a passive report into an active, persuasive communication tool.
5. Final Application Exercise: Sketch Your Dashboard
Now, let's bring everything together. Your task is to create a low-fidelity sketch of the main screen of your transformation dashboard, designed for the CEO. You can draw this on paper or use any simple diagramming tool.
Your sketch should include:
- Clear Sections: Organize the layout using the Performance, Pipeline, and Health & Risk model.
- Visual Hierarchy: A prominent KPI in the top-left corner.
- KPIs and Visualizations: For each of the three sections, include at least one key metric. Specify the visualization type you would use (e.g., "Line Chart," "Big Number," "Bar Chart").
- Context: For one of your KPIs, explicitly state what context you will provide (e.g., "vs. Target," "vs. Last Quarter").
- A Story: Include a placeholder for a "Narrative Insight" text box that exemplifies the Setup-Conflict-Resolution model.
This exercise will serve as a tangible artifact and a blueprint for the dashboard you would build for your transformation program.
Conclusion
In this lesson, we have moved from the abstract world of metrics to the practical craft of visual design and communication. You now have a framework for designing executive dashboards that are not just informative, but also persuasive and actionable.
Key Takeaways:
- Architect for the Audience: Structure your dashboard around the strategic questions executives ask, using a model like Performance, Pipeline, and Health & Risk.
- Design for Clarity: Employ visual design principles like minimalism, hierarchy, and context to ensure your message is understood in seconds.
- Tell a Compelling Story: Use the Setup, Conflict, and Resolution framework to transform your data from a static report into a narrative that drives decisions.
Preview of the Next Lesson
We have now designed the conceptual and visual blueprint for our transformation dashboard. The next logical step is to think about implementation. How do we get the data to flow into this dashboard automatically, and how do we ensure the insights it generates are integrated into the organization's daily rhythm?
In our next lesson, we will focus on this challenge: "Plan the integration of transformation tracking tools into existing organizational workflows." We'll discuss the technical and process-related steps to make your dashboard a living, breathing part of your transformation program.