Introduction
Welcome to the final lesson in our module on the Transformation Tech Stack. In our last session, you created a plan for integrating various tracking tools into your company's workflows, essentially designing the data pipelines that will feed your transformation dashboard. You now have a blueprint for how to collect real-time data.
Today, we address the crucial "so what?" question. A dashboard full of data is merely expensive digital wallpaper if it doesn't lead to better decisions. This lesson focuses on the learning outcome: Interpret real-time adoption data to make evidence-based transformation decisions.
We will explore how to move from observing data to driving action by:
- Distinguishing between insightful metrics and misleading "vanity" metrics.
- Identifying early warning signs of adoption failure from real-time data.
- Formulating hypotheses to diagnose the root causes of problems.
- Using data to tell a compelling story that mobilizes leaders to act.
Your extensive experience in product management and business analysis will be a significant asset here. The process of interpreting user adoption data for a new software feature is analogous to interpreting transformation adoption data for a new process or system. We're applying the same diagnostic and strategic thinking, but at an organizational scale.
1. From Metrics to Meaning: Focusing on Business Impact
The first and most critical step in interpreting data is ensuring you're looking at the right data. Many transformation programs get derailed by focusing on "vanity metrics"—numbers that look impressive but have no direct link to business value.
For example, celebrating a high number of logins to a new system is meaningless if users are not completing key tasks or if their productivity has dropped. This is where we must connect adoption data to concrete business outcomes.
Why Digital Adoption Platforms Fail and How to Prevent It
The article 'Why Digital Adoption Platforms Fail' from Apty provides an excellent analysis of this common pitfall. It starkly contrasts the metrics that teams often report with what business leaders actually need to know.
Please read the section titled 'Root cause #3: Measuring adoption instead of business impact.' Pay close attention to the 'DAP Reports vs Business Leader Priorities' table. It perfectly captures the disconnect between activity metrics and impact metrics.
As the article makes clear, an evidence-based decision requires evidence of business impact. Instead of asking "Are people using the new tool?", you should be asking:
- Did we reduce the number of support tickets?
- Did we improve productivity or reduce process cycle time?
- Did we reduce process errors or rework?
- Is the return on investment (ROI) for the new software improving?
To ensure your dashboard drives meaningful decisions, you must define metrics that directly answer these kinds of questions.
2. A Framework for Interpretation: From Data to Diagnosis
Once you have a dashboard tracking business-relevant metrics, you need a framework for interpreting the signals. A red metric on a dashboard is a symptom, not a diagnosis. Your role is to act like a detective, using the data to form hypotheses about the underlying cause.
Let's start with a practical, five-step approach for managing the process from data to action.
Drive transformation success with digital adoption metrics
This article from Deloitte, 'Drive transformation success with digital adoption metrics,' outlines a strategic cycle for using data. It provides a high-level structure for our work.
Please read the section 'A 5-step approach to digital adoption management.' We are focusing today on steps 4 (Analyze) and 5 (Take action).
The Deloitte article provides the "what to do," and now we'll dive into the "how to do it."
Step 1: Identify the Warning Signs
Dashboards provide a continuous stream of data. The key is to recognize patterns that signal a problem.
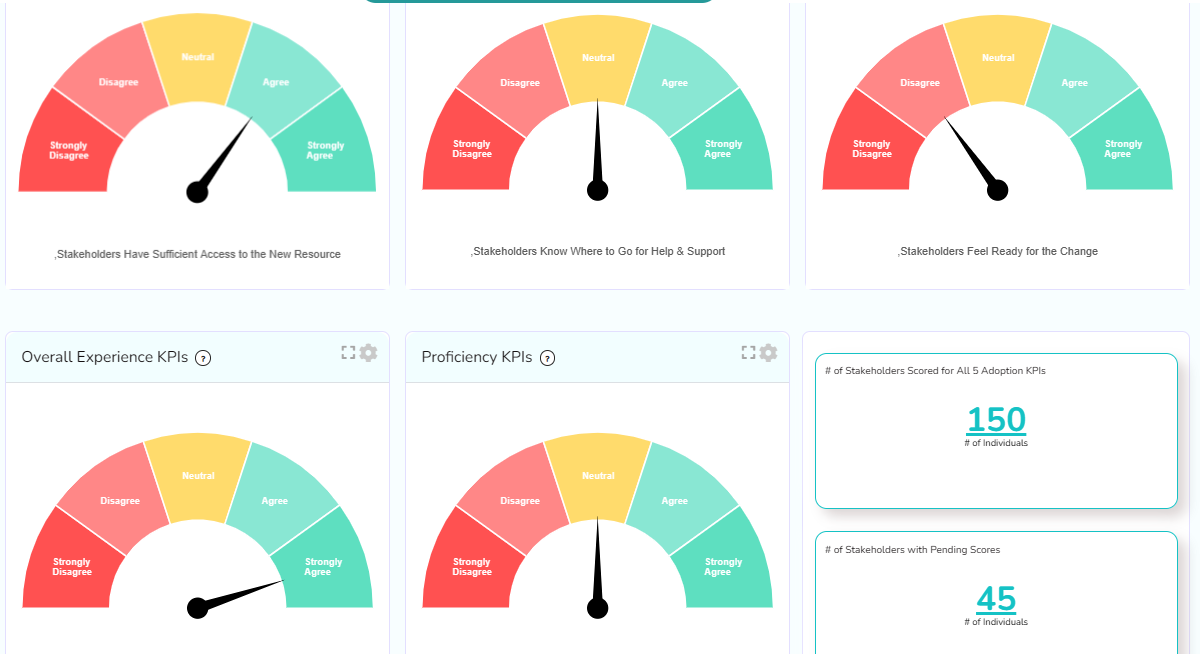
Imagine the gauge for "Stakeholders Feel Ready for the Change" for your Sales department drops from green to red a month after you've rolled out a new CRM module. This is a clear warning sign. But what does it mean?
The Apty article provides an excellent guide to interpreting these signals by comparing normal patterns to warning signs at different stages of a rollout.
Why Digital Adoption Platforms Fail and How to Prevent It
Let's return to the Apty article to look at some concrete examples of what 'bad' looks like. This will help you build a mental library of red flags to watch for.
Read the section 'Early warning signs your digital adoption platform is failing.' Focus on the two tables: 'Digital Adoption Performance Health Check' and 'Rollout Health Check.' These tables give you specific, data-backed examples of what to look for in the first 1-6 months of a rollout.
Step 2: Formulate a Hypothesis
Seeing that the Sales team feels unready is the observation. The next step is to form a hypothesis about the cause. Based on the data you have, potential hypotheses could be:
- Hypothesis A (Process): "The new CRM workflow is more complex than the old one, and users are struggling to adapt, leading to frustration."
- Hypothesis B (Value): "The training focused on features but failed to explain how the new CRM helps Sales close deals faster, so they don't see the value."
- Hypothesis C (Incentive): "The new CRM requires logging data that isn't connected to the commission plan, so reps feel it's just 'extra work' with no reward."
Your dashboard should ideally contain metrics that help you test these hypotheses. For example, the Deloitte article mentions a framework of measuring Activity, Fluency, Independence, and Satisfaction. If you see high Activity (logins) but low Fluency (high error rates, long task completion times), it would support Hypothesis A. If qualitative feedback (part of Satisfaction) is full of comments like "Why are we doing this?", that points toward Hypothesis B.
Step 3: Decide on an Action
Your data-driven hypothesis allows you to propose a targeted intervention, moving from analysis to action. The action should directly address the likely root cause.
- If you suspect Hypothesis A, the action might be to deploy in-app guidance (using a DAP) for complex workflows or hold targeted workshops.
- If you suspect Hypothesis B, the action could be to create new communication materials with success stories from early adopters or have sales leaders champion the benefits in team meetings.
- If you suspect Hypothesis C, the action would be to escalate the issue to leadership to review and align the commission plan with the new process.
The decision isn't always a major intervention. It could simply be to dig deeper with qualitative methods like focus groups or direct observation to validate your hypothesis before acting.
3. Communicating the Decision: Telling the Data's Story
Identifying a problem and a solution is only half the battle. As a change leader, you must use the data to tell a compelling story that convinces sponsors and stakeholders to support your proposed action. A list of numbers won't mobilize anyone; a clear narrative will.
A simple and powerful structure for this narrative is Setup, Conflict, Resolution.
Telling Stories with Data in 3 Steps (Quick Study)
This short video from Harvard Business Review explains a classic storytelling framework. While it uses a financial chart as an example, the principle is universal for presenting any data-driven finding.
Watch the first two minutes of the video (00:00 - 02:57), which introduce the 'Setup, Conflict, Resolution' structure and show how to find it within a data chart.
Here is how you would apply this to our Sales team example:
- Setup (The new reality): "Last month, we successfully rolled out the new CRM module to the Sales department as a key pillar of our GTM transformation."
- Conflict (The problem the data reveals): "However, our real-time adoption dashboard shows a critical issue. While login rates are high, productivity has dropped 15%, and readiness sentiment has fallen into the red. Our hypothesis, supported by user feedback, is that the new workflow is misaligned with the current commission plan, creating friction and frustration. If we don't act, we risk missing our Q4 sales targets."
- Resolution (The evidence-based decision): "Therefore, I am recommending we immediately form a tiger team with Sales Ops and HR to review and align the commission plan. We will pause further feature rollouts to this team until we resolve this. This targeted intervention will address the root cause and get adoption back on track."
This narrative structure transforms a data report into a compelling case for action. It presents the stakes clearly and offers a logical, data-backed path forward.
4. Application Exercise: You are the Analyst
It's time to put these concepts into practice. Imagine you are leading the change management for a transformation at a B2B software company. One initiative is the rollout of a new AI-powered feature recommendation engine to your Customer Success Managers (CSMs) to help them with upselling.
You are reviewing the dashboard data from the first month of the pilot with 10 CSMs.
Pilot Data (Month 1):
| Metric | Target | Actual | Status |
|---|---|---|---|
| Adoption Rate (at least 1 login/day) | > 80% | 90% | Green |
| Feature Usage (% of CSMs sending >5 AI-recs/week) | > 70% | 10% | Red |
| User Sentiment (Net Promoter Score via DAP survey) | > +20 | -40 | Red |
| Support Tickets (related to AI feature) | < 5 | 22 | Red |
Qualitative Feedback Snippets from DAP & Support Tickets:
- "I logged in, but I don't trust the recommendations it's giving me for my key accounts."
- "It's just faster to use my own list of features to discuss with clients."
- "The training was just a demo of the buttons. It didn't cover how to weave this into my strategic client calls."
Your Task:
Based on the data and concepts from this lesson, please provide the following:
- Interpret the Data: What is the real story here? Look past the "green" vanity metric (Adoption Rate) and describe the core problem.
- Formulate a Hypothesis: State one clear, testable hypothesis that explains why feature usage is low despite high logins.
- Propose a Decision: Based on your hypothesis, recommend one primary action to take next. Should you intervene, investigate further, or adjust the plan? Be specific.
- Craft the Narrative: Write a few sentences outlining how you would present this finding to your project sponsor using the Setup, Conflict, Resolution framework.
Conclusion
In this lesson, we closed the loop on the transformation tech stack. You've learned that collecting real-time data is only the first step. The true value comes from your ability to interpret that data to make smart, timely, and evidence-based decisions.
Key Takeaways:
- Focus on Impact, Not Activity: Prioritize business outcome metrics (e.g., productivity, error rates) over vanity metrics (e.g., logins, clicks).
- Data Is for Diagnosis: Use dashboards to spot warning signs and formulate hypotheses about the root causes of adoption challenges.
- Turn Insights into Action: A hypothesis should lead to a clear decision, whether it's a direct intervention, a deeper investigation, or a change to the transformation plan.
- Narrate Your Data: An evidence-based decision requires a compelling story to gain stakeholder support. Frame your findings using the Setup, Conflict, Resolution structure to drive action.
Preview of the Next Lesson
You have now designed a transformation dashboard, planned its integration, and learned how to use its data to make decisions. You have the tools and skills to guide a transformation workstream effectively.
This concludes our module on the Transformation Tech Stack. In our next module, "Continuous Improvement and BAU Integration," we will shift our focus to long-term sustainability. The first lesson will address: "Design a transition plan for handing off transformation workstreams to BAU operations." We'll explore how to ensure the positive changes you've driven with data become a permanent part of how the organization runs.