Hello! Welcome back to our module on "Data Analysis and Manipulation with Pandas."
In our last lesson, we learned how to get data into a pandas DataFrame and perform a high-level inspection using methods like .head(), .shape, and .info(). This is like getting the 'lay of the land' for your dataset.
Now, we move from a bird's-eye view to a ground-level investigation. As a Business Analyst, you'll constantly need to answer specific questions: "Which campaigns had the highest spend?", "What were the results for our social media channels?", "Show me all campaigns that launched in Q4." To answer these, you need to 'zoom in' on the data.
This lesson is all about that process: selecting and filtering. You will learn how to isolate specific columns and rows to answer targeted business questions. This is one of the most fundamental and frequently used skills in data analysis.
By the end of this lesson, you will be able to select and filter data from DataFrames using:
- Column labels to select specific data series.
- Conditional logic to filter rows that meet certain criteria.
- The
.locand.ilocaccessors for precise, label- and position-based selection.
1. Selecting Columns
Let's continue with the AdTech campaign DataFrame from our last lesson. First, a quick refresh on creating it:
import pandas as pd

ad_data = {
    'campaign_name': ['Summer Sale', 'Holiday Push', 'Brand Awareness', 'Q4 Retargeting', 'Spring Promo'],
    'impressions': [150000, 220000, 500000, 80000, 120000],
    'clicks': [3000, 3500, 1200, 2500, 2800],
    'spend': [450.00, 600.50, 800.00, 350.00, 400.00],
    'channel': ['PPC', 'Social', 'Display', 'PPC', 'Social']
}
df_ads = pd.DataFrame(ad_data)
The simplest filtering you can do is to select one or more columns you're interested in.
- To select a single column, you use square brackets
[]with the column's name as a string. This returns a pandas Series object.# Select just the 'spend' column df_ads['spend'] - To select multiple columns, you use a list of column names inside the square brackets
[[]]. This returns a new, smaller DataFrame.# Select campaign name, clicks, and spend df_ads[['campaign_name', 'clicks', 'spend']]
This is your first step in narrowing down a large dataset to only the information that is relevant to your current question.
2. Filtering Rows with Conditional Logic
Now for the real power: selecting rows that meet a specific condition. For example, "find all campaigns that spent more than $500."
The way pandas handles this is intuitive but important to understand. Let's see how it works.
Python Pandas Tutorial (Part 4): Filtering - Using Conditionals to Filter Rows and Columns
This video from Corey Schafer's excellent pandas series clearly explains the concept of 'boolean masking,' which is the foundation of filtering in pandas. Understanding this will make all subsequent filtering techniques much easier to grasp.
Watch the segment from 00:51 to 04:38. Pay close attention to how a comparison (e.g., last_name == 'Doe') produces a Series of True/False values, and how that 'mask' is then used to select the rows from the DataFrame.
As the video explained, filtering is a two-step process:
- Create a Condition: You write a comparison that evaluates to
TrueorFalsefor each row. This creates a boolean "mask" or "filter". - Apply the Filter: You pass this mask back into the DataFrame to select only the rows where the condition was
True.
Let's try it with our df_ads data. Suppose we want to find all campaigns that resulted in more than 2,000 clicks.
# Step 1: Create the condition. This returns a Series of True/False values.
high_clicks_filter = df_ads['clicks'] > 2000

print("This is the filter/mask:")
print(high_clicks_filter)
# Output:
# 0     True
# 1     True
# 2    False
# 3     True
# 4     True
# Name: clicks, dtype: bool

# Step 2: Apply the filter to the DataFrame
df_ads[high_clicks_filter]
Running this code will display only the rows for 'Summer Sale', 'Holiday Push', 'Q4 Retargeting', and 'Spring Promo', because the 'Brand Awareness' campaign had fewer than 2,000 clicks.
3. The Best Practice: Using .loc and .iloc
While using df[filter] works perfectly, the standard and more powerful way to select data is with the .loc and .iloc accessors. They provide more flexibility and help avoid ambiguity.
.loc: Selects data by label (e.g., row and column names)..iloc: Selects data by integer position (e.g., the 1st row, 3rd column).
This is a crucial distinction. Let's dig into it.
Iloc vs Loc in Pandas: A Guide With Examples
The article 'Iloc vs Loc in Pandas: A Guide With Examples' from DataCamp provides a fantastic, clear breakdown of how these two accessors work, with simple examples for each use case.
Read the sections 'What Are .loc and .iloc in Pandas?', 'Using .loc: Selection by Labels', 'Using .iloc: Selection by Integer Position', and '.iloc vs .loc: When to Use Which'. Focus on the syntax differences and the inclusive/exclusive nature of slicing.
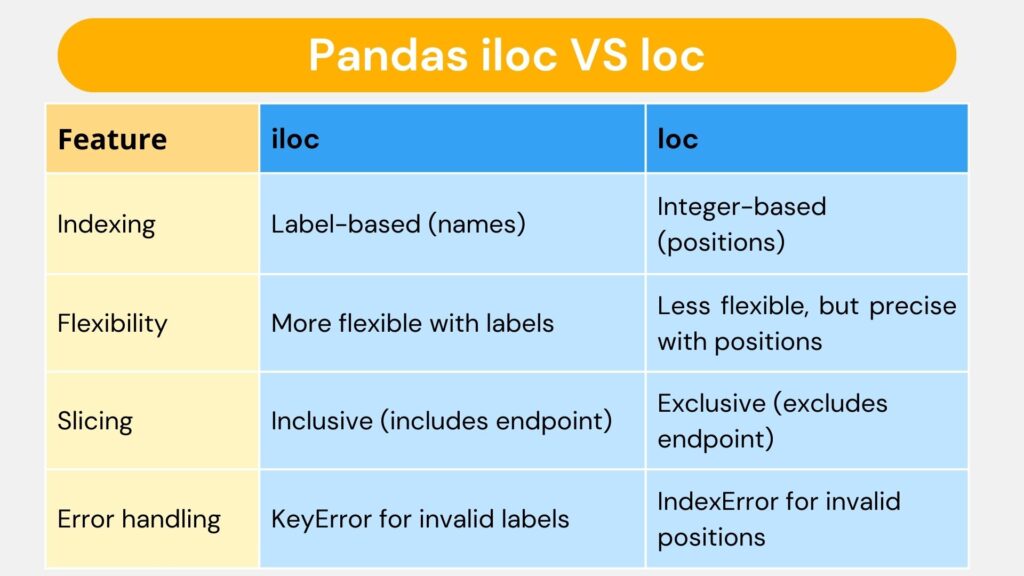
Here's a visual summary of the key differences:
Using .loc for Conditional Filtering
The .loc accessor is the recommended tool for conditional filtering. The syntax is df.loc[row_condition, column_selection].
Let's re-run our clicks > 2000 filter, but this time using .loc. A major advantage is that we can select the columns we want at the same time.
# Using our same filter from before
high_clicks_filter = df_ads['clicks'] > 2000

# Select all columns for the rows that meet the condition
df_ads.loc[high_clicks_filter]

# A more powerful use: select only specific columns for those rows
df_ads.loc[high_clicks_filter, ['campaign_name', 'clicks', 'channel']]
This second command is extremely useful. You've filtered to the rows you care about and simultaneously selected only the columns you need for your analysis.
Using .iloc for Positional Selection
The .iloc accessor is used when you need to grab data by its position, regardless of its label. Remember that Python indexing starts at 0.
# Select the first row
df_ads.iloc[0]

# Select the first three rows
df_ads.iloc[0:3] # Note: Selects rows 0, 1, 2. The end position (3) is excluded.

# Select the first row, second column (clicks)
df_ads.iloc[0, 2]

# Select the first two rows and the first three columns
df_ads.iloc[0:2, 0:3]
Test your understanding!
Using the df_ads DataFrame, how would you select the campaign_name and spend for the last two campaigns in the table? Try to write the code using both .loc and .iloc.
Show answer
Here are the solutions:
Using .loc (label-based):
The last two rows have index labels 3 and 4.
df_ads.loc[3:4, ['campaign_name', 'spend']]
Note: With .loc, slicing 3:4 is inclusive, so it gets rows with labels 3 and 4.
Using .iloc (position-based):
The last two rows are at positions -2 and -1.
df_ads.iloc[-2:, [0, 3]]
Note: iloc[-2:] selects from the second-to-last row to the end. The columns campaign_name and spend are at positions 0 and 3.
4. Combining Multiple Conditions
Business questions are rarely simple. You'll often need to combine conditions, for example, "find all PPC campaigns that spent less than $400."
To do this, you use logical operators:
&for AND (both conditions must be true)|for OR (at least one condition must be true)~for NOT (negates a condition)
Important: Each condition must be wrapped in its own set of parentheses.
This video demonstrates these techniques, along with other powerful methods like .isin() and string-based filtering.
Python Pandas Tutorial (Part 4): Filtering - Using Conditionals to Filter Rows and Columns
Let's return to Corey Schafer's video. This part shows how to build more complex and realistic filters by combining conditions and using special helper methods.
Watch the segments from 06:18-09:36 and 13:39-18:56. This covers & (AND), | (OR), ~ (NOT), .isin() for multiple values, and .str.contains() for text filtering.
Let's apply these to our df_ads DataFrame:
AND (&)
Find all PPC campaigns that had more than 2,000 clicks.
filter_and = (df_ads['channel'] == 'PPC') & (df_ads['clicks'] > 2000)
df_ads.loc[filter_and]
OR (|)
Find all campaigns that were either 'Display' channel OR had impressions over 200,000.
filter_or = (df_ads['channel'] == 'Display') | (df_ads['impressions'] > 200000)
df_ads.loc[filter_or]
Filtering with a List (.isin())
This is a very clean way to write an 'OR' condition for a single column. Let's find all campaigns on either the 'PPC' or 'Social' channel.
channels_of_interest = ['PPC', 'Social']
filter_isin = df_ads['channel'].isin(channels_of_interest)
df_ads.loc[filter_isin]
Filtering by Text (.str.contains())
Find any campaign with 'Sale' or 'Promo' in its name. The | here acts as an "OR" within the string search.
filter_str = df_ads['campaign_name'].str.contains('Sale|Promo')
df_ads.loc[filter_str]
Note: String methods have na=False as a good practice to handle potential missing values, which we will cover in the next lesson.
Conclusion
You have just learned one of the most essential skills for any data analyst. Being able to efficiently select, slice, and filter your data is the foundation upon which all further analysis is built. You can now move beyond simply looking at your data to actively interrogating it to find answers.
Key Takeaways:
- Select columns using
df['col']for one ordf[['col1', 'col2']]for multiple. - Conditional filtering works by creating a boolean mask (
True/FalseSeries) and applying it to the DataFrame. .locis the preferred method for filtering. It uses labels and allows you to select rows and columns in one step:df.loc[row_condition, column_labels]..ilocis used for selecting data by its integer position.- Combine conditions using
&(AND) and|(OR), remembering to wrap each condition in parentheses. - Use
.isin()to check against a list of values and.str.contains()for powerful text-based filtering.
Preview of the Next Lesson:
In our examples, the data was perfectly clean. In the real world, this is rarely the case. You'll often find missing data, represented in pandas as NaN (Not a Number). Our next lesson will focus on a critical data cleaning step: handling missing values. We'll learn how to find them, decide whether to remove them, and learn techniques to fill them in intelligently.