Hello! Welcome to the first lesson in our module on "Data Analysis and Manipulation with Pandas."
In our last lesson, you mastered the essential skill of managing Python packages with pip and creating isolated project environments. This was the final step in building your foundational Python knowledge.
Today, we put that skill into practice. We will install and begin using pandas, the single most important library for data analysis in Python. As a Business Analyst, much of your work will involve receiving, cleaning, exploring, and summarizing data. Pandas is your primary tool for all of these tasks.
This lesson focuses on the first, most fundamental step in any data analysis workflow: getting your data into a workable format and performing an initial "health check." We'll explore the core data structure in pandas, the DataFrame, which is conceptually similar to a spreadsheet or an SQL table.
By the end of this lesson, you will be able to:
- Understand the structure of a pandas DataFrame.
- Create a DataFrame from scratch using a Python dictionary.
- Load data from a common file format (CSV) into a DataFrame.
- Inspect a DataFrame to understand its size, structure, and content.
1. Your First Steps: Setting Up and Understanding the DataFrame
Before we can do anything, we need to set up our project environment, just as we learned in the last lesson.
- Create a new folder for this project (e.g.,
pandas_analysis). - Navigate into that folder using your terminal.
- Create a virtual environment:
python -m venv venv - Activate it:
.\venv\Scripts\activate(on Windows) orsource venv/bin/activate(on macOS/Linux). - Now, install pandas:
python -m pip install pandas
With pandas installed, let's talk about its core component: the DataFrame.
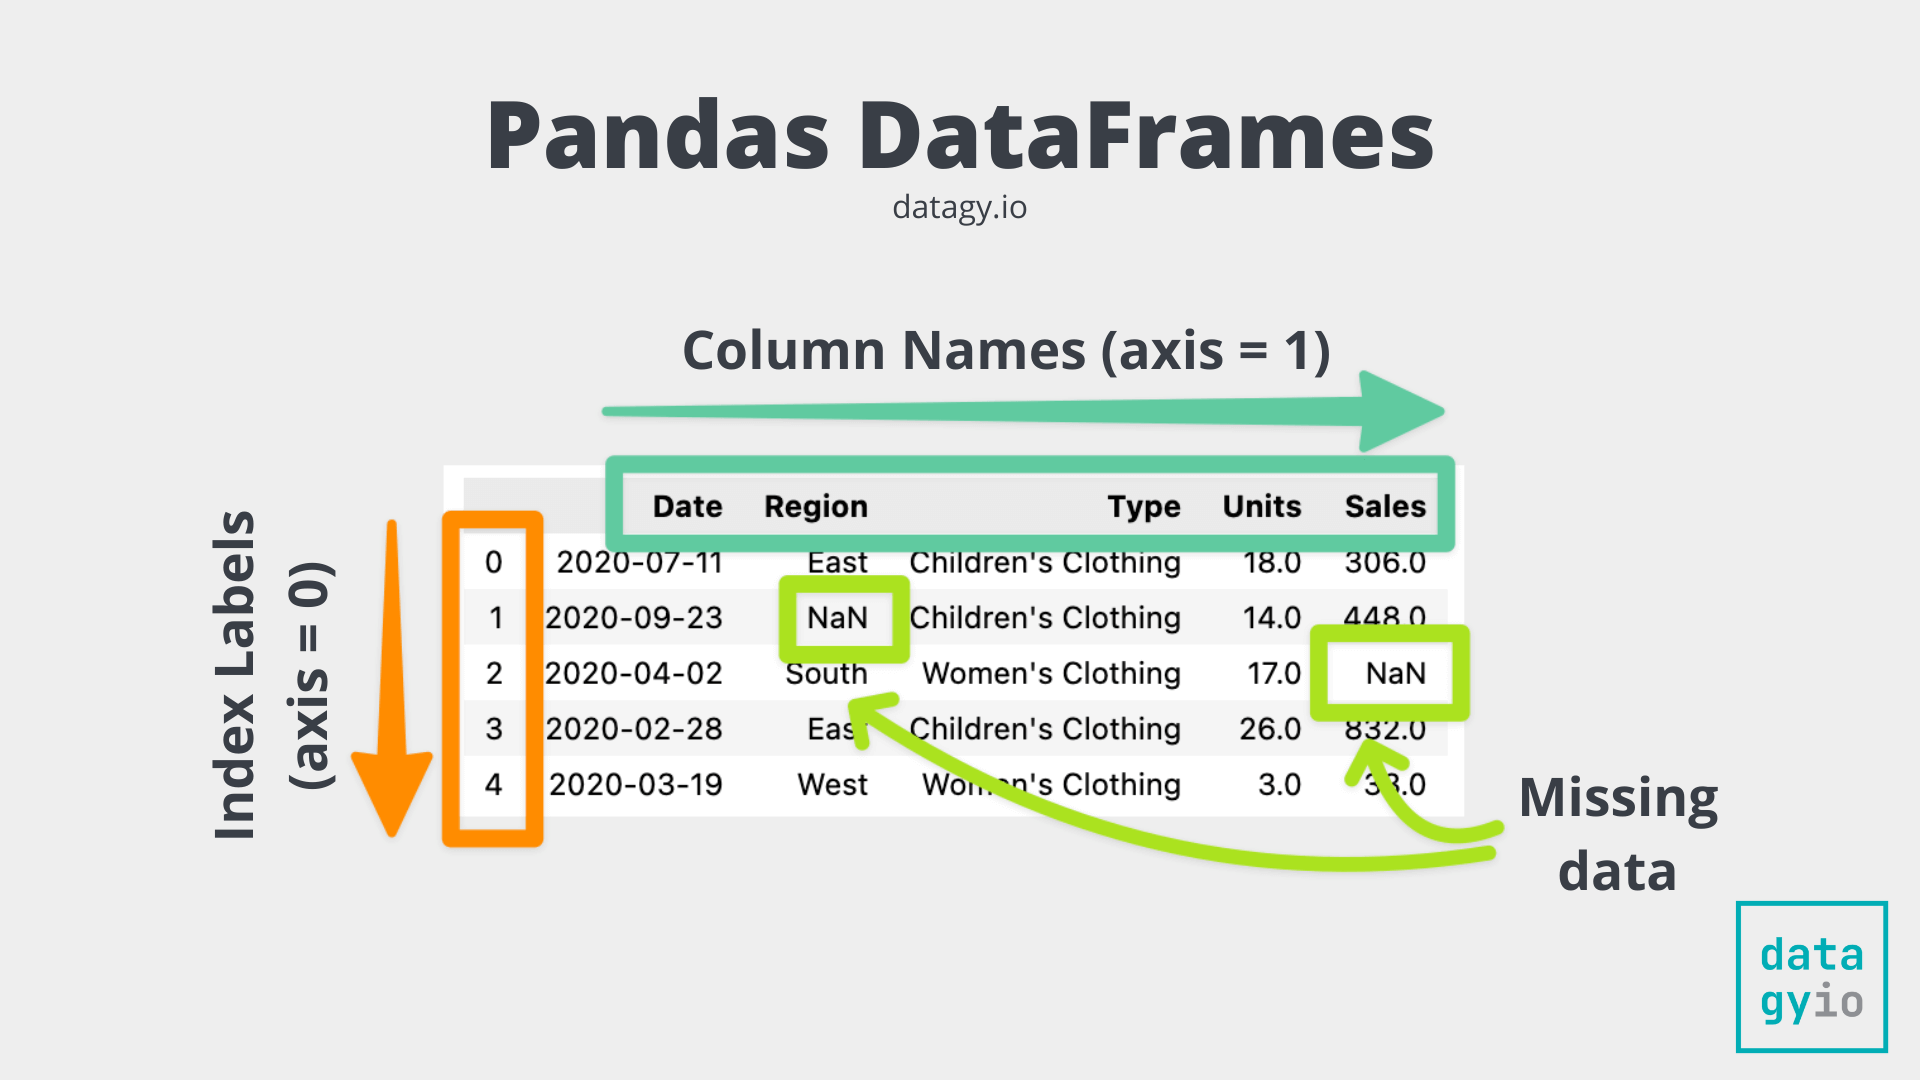
A DataFrame is a two-dimensional, labeled data structure with columns of potentially different types. You can think of it as a spreadsheet, an SQL table, or a dictionary of Series objects. It is the main object you will work with in pandas.
2. Creating DataFrames
As a Business Analyst, you'll get data from various sources. Pandas makes it easy to load data, whether you're creating a small dataset from scratch or importing a large file from a stakeholder.
Creating a DataFrame from a Dictionary
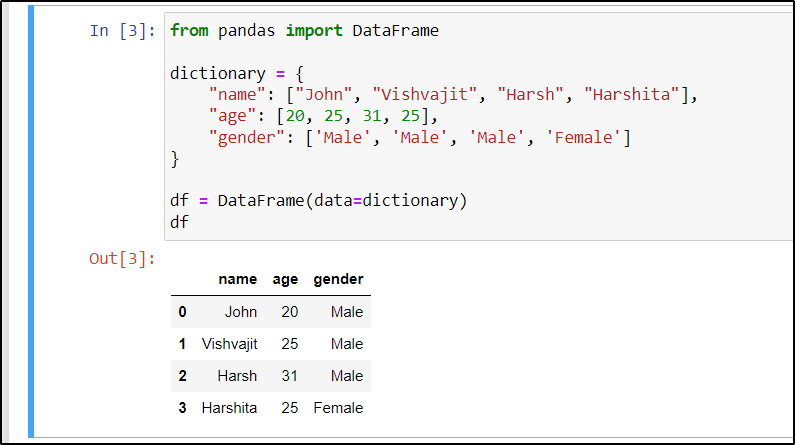
One common way to create a DataFrame is from a Python dictionary. This is useful when you have structured data that you've collected or need to record manually. The dictionary keys become the column names, and the values (which should be lists of equal length) become the column data.
Creating a DataFrame from a CSV file
More often, you will receive data as a file. The most common format is a Comma-Separated Values (CSV) file. This is a simple text file where values are separated by commas, which you can easily export from Excel or any database. Pandas has a powerful function, pd.read_csv(), to handle this.
Let's watch a short video that demonstrates both of these creation methods.
Python Pandas Tutorial 2: Dataframe Basics
The video 'Python Pandas Tutorial 2: Dataframe Basics' by codebasics provides a clear, step-by-step guide to creating DataFrames. We'll focus on the first few methods shown.
Watch the video from 02:00 to 04:25. The first part shows how to load a weather data CSV file using pd.read_csv(). The second part demonstrates creating the same DataFrame from a Python dictionary.
As you can see, loading data is often just a single line of code. For your AdTech work, you might receive a CSV with campaign data like this:
import pandas as pd

# Let's assume you have a file named 'campaign_data.csv'
# with the following content:
# campaign_name,impressions,clicks,spend,channel
# Summer Sale,150000,3000,450.00,PPC
# Holiday Push,220000,3500,600.50,Social
# Brand Awareness,500000,1200,800.00,Display

# You would load it like this:
# df = pd.read_csv('campaign_data.csv')

# For practice without a file, we can create it from a dictionary:
ad_data = {
    'campaign_name': ['Summer Sale', 'Holiday Push', 'Brand Awareness'],
    'impressions': [150000, 220000, 500000],
    'clicks': [3000, 3500, 1200],
    'spend': [450.00, 600.50, 800.00],
    'channel': ['PPC', 'Social', 'Display']
}

df_ads = pd.DataFrame(ad_data)

# In a Python script or Jupyter Notebook, typing the variable name
# at the end of a cell will display the DataFrame.
df_ads
3. Inspecting a DataFrame
Once you've loaded your data, the first step is always to inspect it. You need to answer some basic questions:
- How big is the dataset?
- What do the first few rows look like?
- What are the column names and their data types?
- Are there any missing values?
- What are the basic statistics of the numerical columns?
Pandas provides a set of simple functions to answer these questions quickly.
Learning Pandas for Data Analysis? Start Here.
The video 'Learning Pandas for Data Analysis? Start Here.' by Rob Mulla offers a fantastic overview of the most common inspection methods. This will form the basis of your initial data exploration checklist.
Watch the segment from 03:32 to 06:11. It covers .head(), .tail(), .sample(), .columns, .info(), .describe(), and .shape. Pay attention to what each function tells you about the data.
Let's summarize these crucial inspection methods, using our df_ads DataFrame as an example.
-
.shape: Returns a tuple representing the dimensions (rows, columns).- Question it answers: "How many rows and columns are in my dataset?"
df_ads.shapewould return(3, 5).
-
.head(n): Returns the firstnrows (default is 5).- Question it answers: "Can I see a quick sample of what my data looks like from the top?"
df_ads.head(2)would show the 'Summer Sale' and 'Holiday Push' rows.
-
.tail(n): Returns the lastnrows (default is 5).- Question it answers: "What does the end of my dataset look like?"
-
.info(): Provides a concise summary of the DataFrame, including the index dtype, column dtypes, non-null values, and memory usage.- Question it answers: "What are my columns named, how many non-missing values does each have, and what data types are they?" This is your primary tool for spotting missing data at a high level.
-
.describe(): Generates descriptive statistics for the numerical columns.- Question it answers: "What is the count, mean, standard deviation, min, max, and quartile values for my numerical data?" This is great for a quick statistical overview. For example,
df_ads.describe()would quickly tell you the averagespendacross campaigns.
- Question it answers: "What is the count, mean, standard deviation, min, max, and quartile values for my numerical data?" This is great for a quick statistical overview. For example,
-
.columns: Returns the column labels of the DataFrame.- Question it answers: "What are the exact names of all my columns?" This is useful for copying and pasting column names to avoid typos.
Test your understanding!
You've just loaded a CSV file from a marketing partner into a DataFrame called df_partner_data. You run df_partner_data.info() and see the following output for one of the columns:
cost_usd 950 non-null object
The .shape attribute tells you there are 1000 rows in the DataFrame. What two problems should you immediately be concerned about regarding the cost_usd column?
Show answer
- Missing Data: The column has only 950
non-nullvalues, but there are 1000 rows in the DataFrame. This means there are 50 missing values forcost_usdthat need to be investigated. - Incorrect Data Type: The cost should be a numerical value (like
float64orint64), but pandas has read it as anobject(which usually means it's a string). This often happens if the column contains non-numeric characters, like dollar signs$or commas,. You won't be able to perform mathematical calculations on this column until you clean it and convert it to a numeric type.
Conclusion
Excellent work! You've taken your first and most critical step into the world of data analysis with pandas. You now have a repeatable workflow for getting data into a usable format and performing a high-level inspection.
Key Takeaways:
- The DataFrame is the primary data structure in pandas, representing data in a tabular format like a spreadsheet.
- You can create a DataFrame from many sources, with
pd.DataFrame()for dictionaries andpd.read_csv()for CSV files being the most common. - A standard first step after loading data is to inspect it using methods like:
.shapefor dimensions..head()to preview data..info()to check data types and null values..describe()for a statistical summary of numerical columns.
Preview of the Next Lesson:
Knowing the overall structure of your data is essential, but the real power of analysis comes from being able to zoom in on specific parts of it. In our next lesson, we will learn how to select and filter data. You'll learn how to pull out specific columns of interest, select rows that meet certain criteria, and begin answering targeted business questions with your data.