Hello! Welcome to the third lesson in our module on "Data Analysis and Manipulation with Pandas."
In our last lesson, we focused on selecting and filtering data to ask specific questions of our dataset. That skill assumes the data is complete and well-structured. However, in the real world, data is rarely perfect. One of the most common issues you'll encounter as a Business Analyst is missing data.
This lesson tackles that head-on. Incomplete data can lead to incorrect calculations, flawed analysis, and ultimately, poor business recommendations. Knowing how to systematically find and handle these gaps is a critical part of a BA's data responsibilities. It ensures the integrity of your analysis and builds trust with stakeholders.
Today, you will learn how to handle missing values in a pandas DataFrame. Specifically, you will be able to:
- Identify which columns and how many values are missing.
- Remove rows or columns that contain missing data using the
.dropna()method. - Fill missing data with appropriate values using the
.fillna()method. - Recognize and handle custom missing value representations (e.g., "N/A").
Let's begin by learning how to spot the gaps in our data.
1. Identifying Missing Values
In pandas, missing data is typically represented by NaN, which stands for "Not a Number". This is a special floating-point value that acts as a placeholder for data that doesn't exist.
Let's modify our AdTech DataFrame from the previous lesson to include some missing values. We'll need the numpy library to create NaN values.
import pandas as pd
import numpy as np

ad_data_missing = {
    'campaign_name': ['Summer Sale', 'Holiday Push', 'Brand Awareness', np.nan, 'Spring Promo', 'Q4 Retargeting'],
    'impressions': [150000, 220000, 500000, 80000, 120000, np.nan],
    'clicks': [3000, 3500, 1200, 2500, 2800, 2100],
    'spend': [450.00, 600.50, np.nan, 350.00, 400.00, 320.00],
    'channel': ['PPC', 'Social', 'Display', 'PPC', 'Social', 'PPC']
}
df_ads = pd.DataFrame(ad_data_missing)
df_ads
Looking at the table, we can spot the NaN values. But in a dataset with thousands of rows, this isn't practical. The first step in any data cleaning process is to get a summary of missing data. You can do this by combining two methods: .isnull() (or its alias .isna()) and .sum().
df_ads.isnull()returns a DataFrame of the same size, but withTruewhere values are missing andFalsewhere they are not..sum()then treatsTrueas 1 andFalseas 0, giving you a count of missing values in each column.
# Check for missing values and sum them up by column
df_ads.isnull().sum()
The output will be:
campaign_name    1
impressions      1
clicks           0
spend            1
channel          0
dtype: int64
This is an extremely useful command that you will run almost every time you load a new dataset. It immediately tells you where the problems are.
This exact workflow is used by analysts in real-world scenarios. For example, in the guide "How to analyze Google ads data in Python," the first step after loading the data is checking for missing values.
How to analyze Google ads data in Python using Deepnote
This brief snippet from a Deepnote guide on analyzing Google Ads data demonstrates the first practical step in data cleaning. Notice how checking for missing values is done before any analysis begins.
Read just the short section 'Data cleaning and preprocessing'. Observe the use of df.isnull().sum() as the initial check, followed by a decision to fill the missing values.
Now that we know how to find missing data, let's explore our two main strategies for dealing with it: dropping it or filling it.
2. Strategy 1: Dropping Missing Values
The simplest strategy is to remove the rows or columns that contain missing data. The method for this is .dropna(). However, using it without care can lead to deleting a large portion of your valuable data. It's crucial to understand its parameters.
This video provides an excellent walkthrough of .dropna() and its most important arguments.
Python Pandas Tutorial (Part 9): Cleaning Data - Casting Datatypes and Handling Missing Values
Let's watch a segment from Corey Schafer's pandas tutorial series. This part focuses on the .dropna() method and will give you a solid understanding of how to use it precisely.
Watch the video from 00:49 to 09:55. Pay close attention to the explanations of the axis, how, and subset arguments. These three parameters give you full control over what gets dropped.
Let's summarize the key parameters from the video and apply them to our df_ads DataFrame:
axis: Determines whether to drop rows or columns.axis=0oraxis='index'(default): Drop rows containingNaN.axis=1oraxis='columns': Drop columns containingNaN.
how: Specifies the condition for dropping.how='any'(default): Drop the row/column if it has at least oneNaNvalue.how='all': Drop the row/column only if all of its values areNaN.
subset: This is a powerful one. It allows you to only consider specific columns when looking forNaNvalues.
Let's see this in action with our df_ads data.
# Default behavior: drops any row with at least one NaN
# This will drop rows with index 2, 3, and 5
df_ads.dropna()
This is often too aggressive. A more surgical approach is better. As a BA, you might decide that a campaign record is useless for performance analysis if the spend or impressions are missing. We can use the subset parameter for this.
# Drop rows ONLY IF 'spend' or 'impressions' is missing
df_ads.dropna(subset=['spend', 'impressions'])
This is a much more controlled approach. It drops rows 2 and 5 but keeps row 3, because even though the campaign_name is missing, the critical performance metrics are still there.
Test your understanding!
Imagine you have our df_ads DataFrame. Your manager asks for a list of all campaigns run on the 'PPC' channel. The campaign name is absolutely essential for this report. How would you prepare a clean DataFrame for this task, ensuring no missing campaign names?
Show answer
You would use dropna() with the subset argument focused on the 'campaign_name' column.
# Drop rows where the 'campaign_name' is NaN
clean_df = df_ads.dropna(subset=['campaign_name'])

# Now you can filter for PPC campaigns on the clean data
ppc_campaigns = clean_df.loc[clean_df['channel'] == 'PPC']
print(ppc_campaigns)
This ensures that the row with the missing campaign name is removed before you perform the analysis, preventing NaN from appearing in your final report.
3. Strategy 2: Filling Missing Values
Dropping data means losing information. Sometimes, it's better to make an educated guess, or impute, the missing values. The .fillna() method is used for this. The strategy you choose for filling depends entirely on the data and your business context.
This next video explores several powerful ways to use fillna and other related methods.
Python Pandas Tutorial 5: Handle Missing Data: fillna, dropna, interpolate
The codebasics channel offers a great tutorial on handling missing data. This video covers different filling strategies, including using specific values for different columns, and methods ideal for time-series data.
Watch the segments from 04:09 to 06:50 and 07:34 to 13:01. The first part shows how to fill with a constant and how to use a dictionary for column-specific filling. The second part introduces 'forward fill' and 'backward fill', which are very common techniques.
Here are some common filling strategies:
a) Filling with a Constant Value
This is the most straightforward approach. You might replace missing numerical data with 0 or missing text data with a string like 'Unknown'.
# Fill the missing 'spend' with 0.
# This might be appropriate if a missing spend truly means $0 was spent.
df_ads.fillna({'spend': 0})

# Fill the missing 'campaign_name' with 'Unnamed Campaign'
df_ads.fillna({'campaign_name': 'Unnamed Campaign'})
Using a dictionary, as shown in the video and above, is a great practice as it lets you apply different filling rules to different columns in one go.
b) Filling with a Calculated Value (Mean/Median)
For numerical columns, filling with the column's mean or median is a common technique to avoid skewing summary statistics too much.
- Mean: Use
df['column'].mean(). Good for normally distributed data. - Median: Use
df['column'].median(). Better if the data has outliers, as the median is less sensitive to extreme values.
Let's fill the missing spend with the median spend of all other campaigns.
# Calculate the median of the 'spend' column
median_spend = df_ads['spend'].median()

# Fill NaN values in the 'spend' column with the calculated median
df_ads['spend'].fillna(median_spend, inplace=True) # 'inplace=True' modifies the DataFrame directly
df_ads
c) Forward Fill and Backward Fill
As the video explained, method='ffill' (forward fill) and method='bfill' (backward fill) are excellent for ordered data, like a time series.
ffill: Propagates the last valid observation forward.bfill: Uses the next valid observation to fill a gap.
Imagine your campaign data was ordered by date. If the impressions for one day were missing, you might assume they were the same as the day before (ffill).
4. Handling Custom Missing Values
Sometimes, data doesn't use the standard NaN. You might get files where missing values are represented by strings like "N/A", "missing", "---", or a numeric placeholder like -1 or 999. Pandas won't recognize these as missing by default.
This video shows two professional ways to handle this.
Python Pandas Tutorial (Part 9): Cleaning Data - Casting Datatypes and Handling Missing Values
Let's return to Corey Schafer's tutorial. This final clip demonstrates how to handle non-standard missing values, both when you load the data and after it's already in a DataFrame.
Watch from 09:48 to 12:21, and then from 19:51 to 21:54. The first part shows how to use the .replace() method, and the second, more efficient part shows how to use the na_values argument directly inside pd.read_csv().
To summarize the two main techniques:
- During import (Best Practice): When using
pd.read_csv()orpd.read_excel(), you can provide a list of strings to be recognized asNaN. This is the most efficient method.# Example for when you are reading from a file # custom_na_values = ['N/A', 'missing', '--'] # df = pd.read_csv('my_data.csv', na_values=custom_na_values) - After import: If the data is already loaded, you can use the
.replace()method to swap your custom values fornp.nan.df_ads.replace('missing', np.nan, inplace=True)
Conclusion
You've now learned the essential techniques for one of the most common data preparation tasks: handling missing values. This isn't just a technical exercise; it's a core part of ensuring your analysis as a Business Analyst is accurate, credible, and reliable.
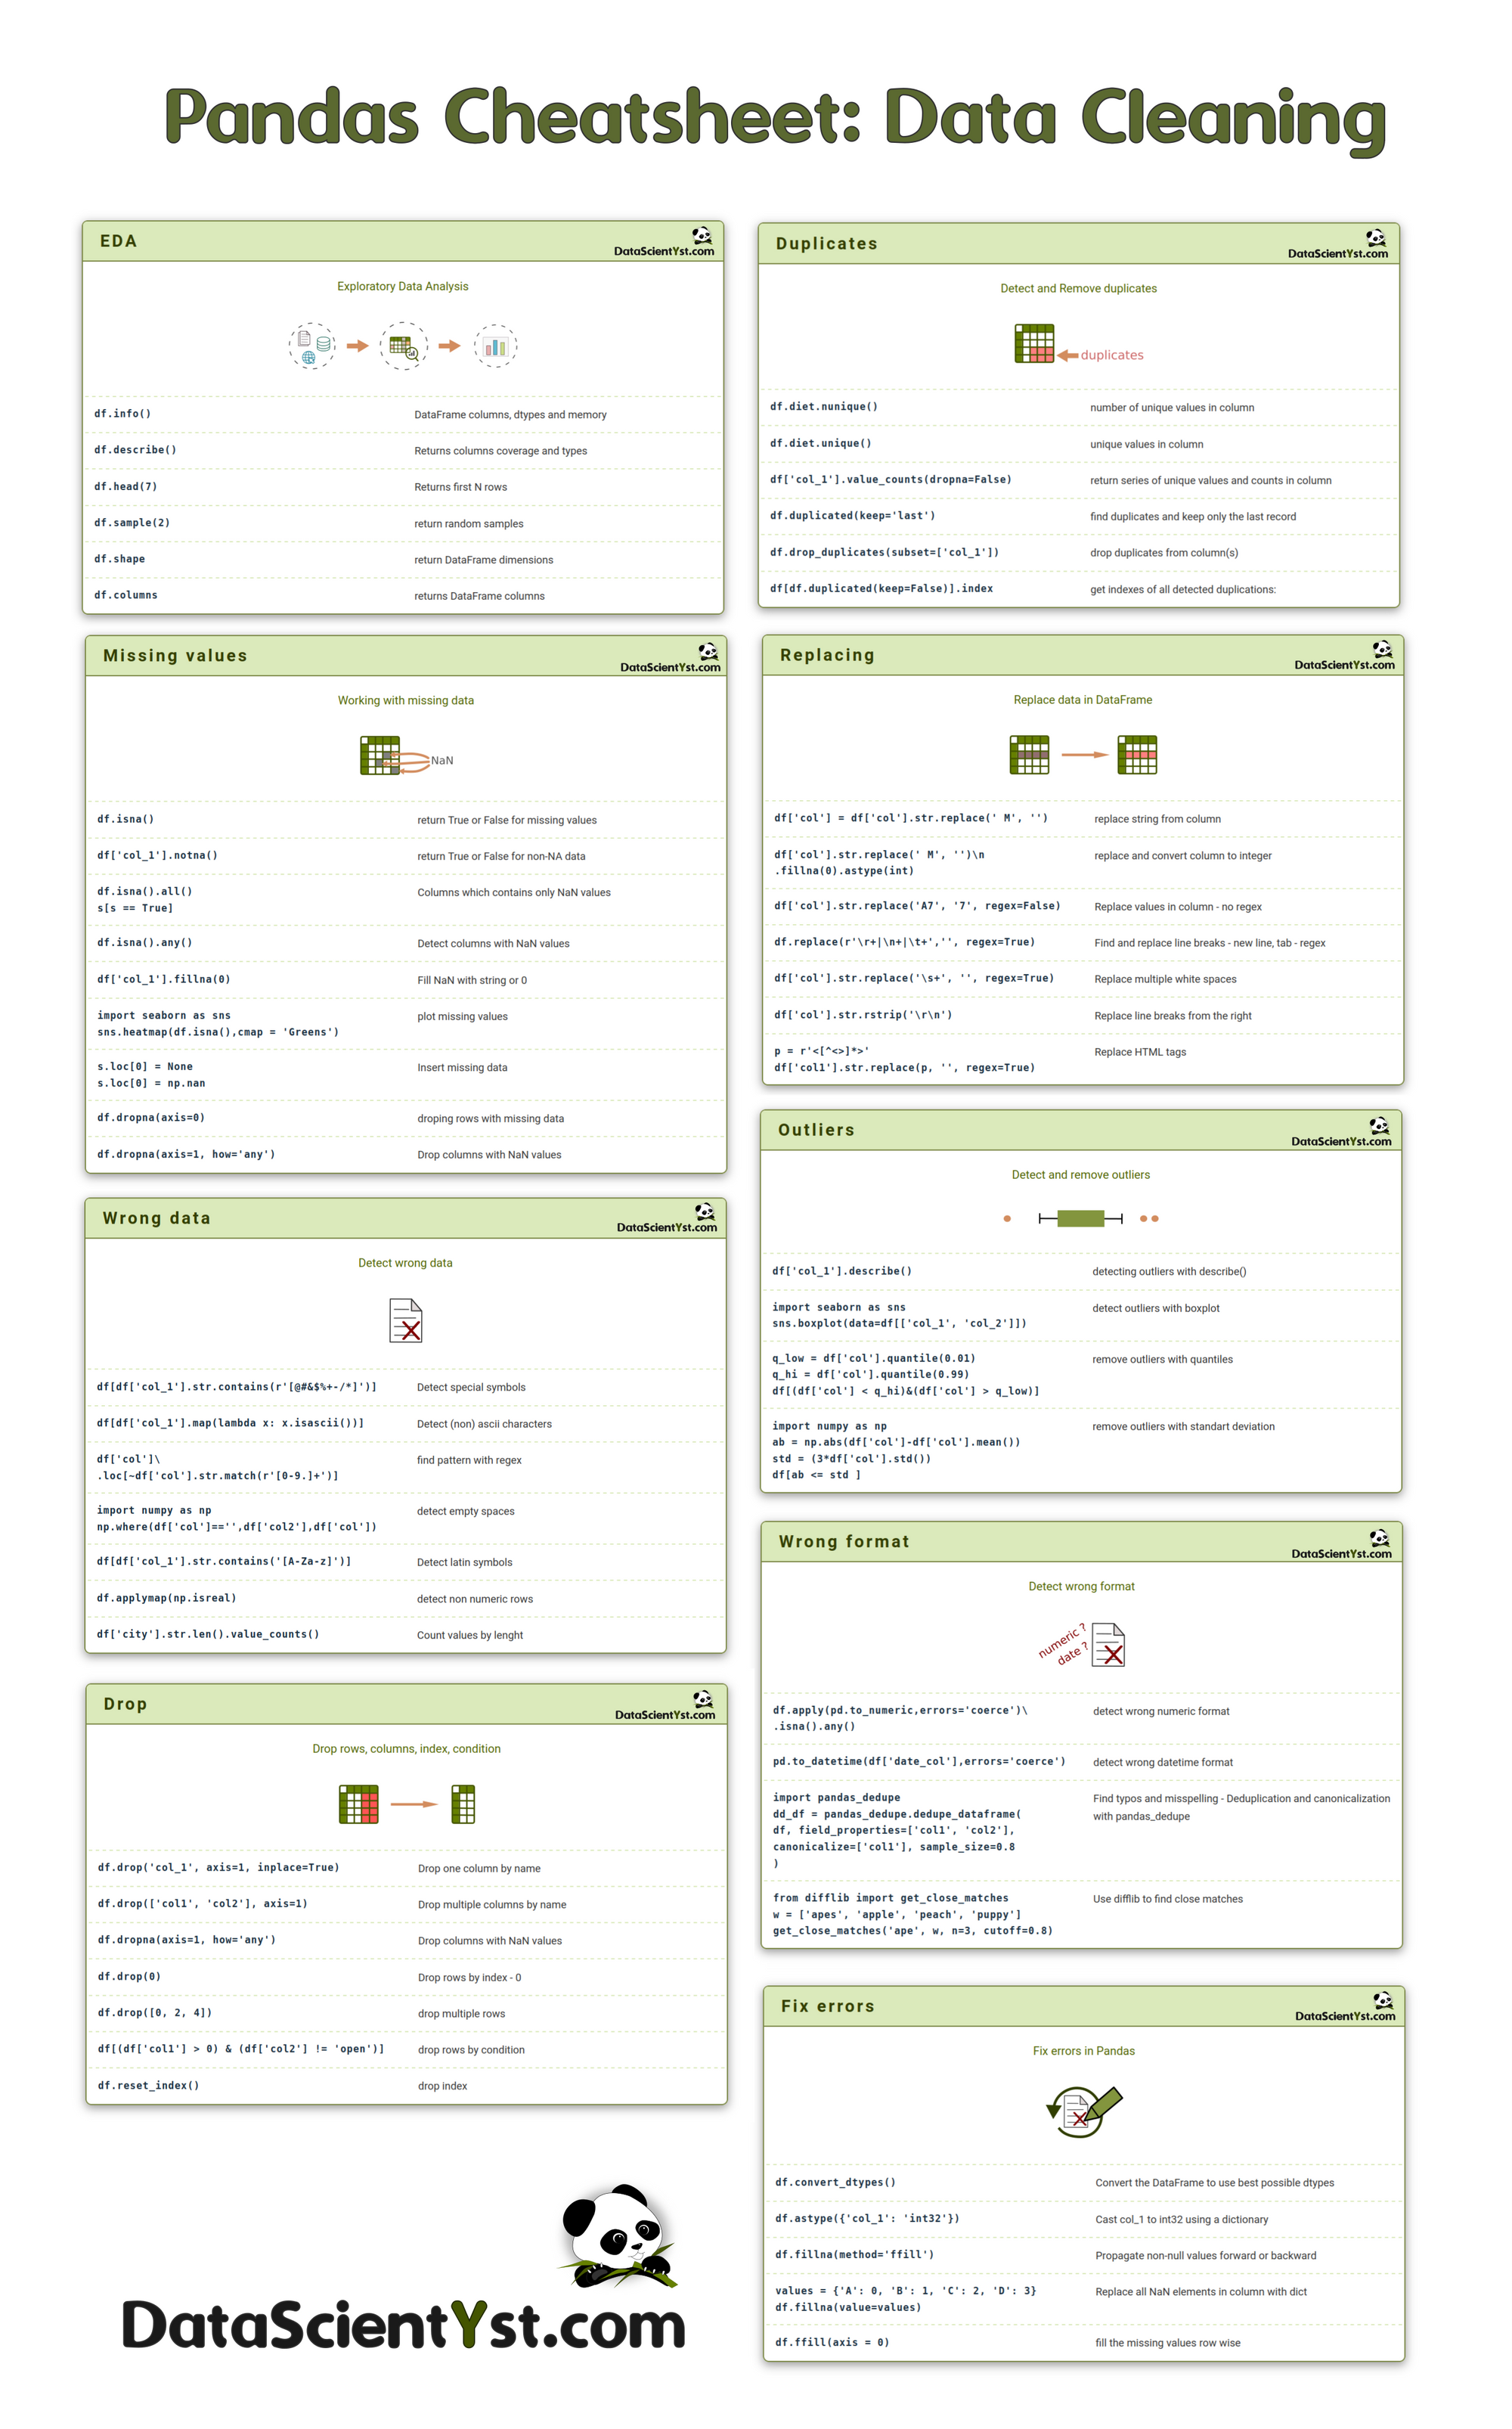
As a quick reference, you can use the 'Missing values' section of this data cleaning cheatsheet.
Key Takeaways:
- Always start by identifying missing data using
df.isnull().sum(). - Dropping (
.dropna()) is a valid strategy when a row is unusable without certain key values. Use thesubsetparameter for precision. - Filling (
.fillna()) is preferred when you want to preserve the other information in a row. The filling strategy (constant, mean/median, ffill) depends on the data and the business context. - Be prepared for custom missing values (e.g., "N/A") and handle them either at import (
na_values) or afterward (.replace()).
Preview of the Next Lesson:
Another common data quality issue is duplicate records. A user signing up twice, a product listed multiple times, or a tracking error can all create duplicates that skew your analysis. In our next lesson, we will learn how to identify and remove duplicate records from your DataFrame.