Hello! In our last lesson, we established the fundamental building blocks of data analysis by learning how to calculate and interpret mean, median, and standard deviation. These statistics give us a snapshot of our data at a single point in time.
Today, we'll build on that foundation to answer a much more dynamic and critical business question: "Are our customers sticking around?" We'll do this by exploring one of the most powerful techniques in a Business Analyst's toolkit. This lesson will teach you how to calculate and interpret cohort retention rates to analyze user behavior over time.
Understanding retention is vital. It tells you if your product is valuable, if your marketing is attracting the right people, and if your business is healthy in the long term. For you, as someone transitioning into a formal BA role, being able to perform and present a cohort analysis is a highly sought-after skill that provides clear, data-driven evidence for stakeholders.
1. What is Cohort Analysis?
First, let's define our terms. A cohort is a group of users who share a common characteristic. For our purposes, the most common characteristic is the acquisition date—the month they signed up, made their first purchase, or installed an app.
Cohort analysis involves tracking these groups over time to see how their behavior evolves. Instead of looking at an overall "average" user, you compare the "January cohort" to the "February cohort" to see if user loyalty is getting better or worse.
To get a solid grasp of this concept and why it's so valuable, let's start with a short reading.
Cohort Retention Analysis: A Comprehensive Guide -
This article, 'Cohort Retention Analysis: A Comprehensive Guide' by Cornel Lazar, offers a clear, business-focused introduction to the topic. It explains what cohort analysis is and why it's a superior method for understanding customer behavior compared to just looking at overall revenue or usage metrics.
Please read the first two sections, 'What is a Cohort Analysis?' and 'The Value of Cohort Analysis'. As you read, think about your experience in AdTech. How could you have used this method to analyze the long-term effectiveness of a specific advertising campaign?
As the article highlights, looking at a single metric like "monthly active users" can be misleading. That number could be growing because you're acquiring new users very quickly, while older users are quietly leaving. Cohort analysis exposes this by showing you exactly what percentage of users from a specific starting period are still active in subsequent months.
2. How to Read a Cohort Retention Table
The most common way to visualize cohort analysis is with a heatmap, often called a retention table. At first glance, it can look intimidating, but it's quite straightforward once you understand its structure.

Let's break down how to read the table above:
- Rows: Each row represents a cohort, grouped by the month they were acquired (e.g., "Dec 2020", "Jan 2021"). The
cohort sizecolumn tells you the total number of customers who joined in that month. - Columns: Each column represents a calendar month, showing user activity over time.
- Cells: The value in each cell is the retention rate. It's the percentage of the original cohort that was still active in that specific month.
For example, let's look at the Dec 2020 cohort:
- Cohort Size: 943 customers.
- Dec 2020: The retention is 100% because this is the month they all joined.
- Jan 2021: The retention is 39%. This means that of the original 943 customers, 372 of them (
943 * 0.39) were still active in January. - Feb 2021: The retention is 33%. Of the original 943 customers, 311 (
943 * 0.33) were still active in February.
Test your understanding!
Using the heatmap image above, answer the following questions:
- What was the retention rate for the Feb 2021 cohort in May 2021?
- In April 2021, which cohort had a higher absolute number of retained users: Jan 2021 or Feb 2021? (You'll need to do a quick calculation).
Show answer
-
Find the "Feb 2021" row. Follow it across to the "Apr 2021" column, then to the "May 2021" column. The retention rate is 30%.
-
To find the absolute number, you multiply the cohort size by the retention rate for that month.
- Jan 2021 cohort in April: 793 users * 28% = ~222 users.
- Feb 2021 cohort in April: 707 users * 31% = ~219 users.
- The Jan 2021 cohort had a slightly higher number of retained users in April, even though its retention percentage was lower. This is an important distinction for a BA to make!
3. Calculating Cohort Retention Rates
Now that you know how to read a retention table, let's walk through how to build one. You don't need complex programming skills to start; this is often done in spreadsheets like Excel or Google Sheets.
The core formula is simple:
The video below provides a fantastic, step-by-step guide to creating a cohort analysis in Excel from raw transaction data. Since your background is in management, you're likely familiar with Excel, making this a great practical starting point.
What is Cohort Analysis? || Retention Rate || Data Analysis || Dynamic Array Formulas
This video from YouExcel Tutorials clearly demonstrates the entire process of building a retention table in Excel. It covers preparing the data, defining cohorts, and calculating the final retention percentages.
Please watch the following segments. You don't need to build it yourself right now, but focus on understanding the logic at each step: Data Preparation (01:48 - 03:22): Watch how the instructor uses formulas to find the first purchase date for each customer. This is the key to assigning each customer to a cohort. Creating Cohorts (03:22 - 04:29): See how the 'first purchase date' is used to group customers into monthly cohorts and how the 'age' of their activity is calculated. Calculating Retention (08:25 - 10:37): This is the most important part. Pay close attention to how the retention formula is applied and how conditional formatting is used to create the final heatmap.
This hands-on process is a typical task for a BA. You start with raw data (like sales or activity logs), clean and structure it to identify cohorts, and then aggregate it to calculate the key retention metric.
4. Interpreting Cohort Analysis: Finding the Story
Creating the chart is the technical part; interpreting it is where a Business Analyst provides true value. Your goal is to turn the data into a story with actionable insights.
When you look at a retention chart, you should be looking for answers to these key questions:
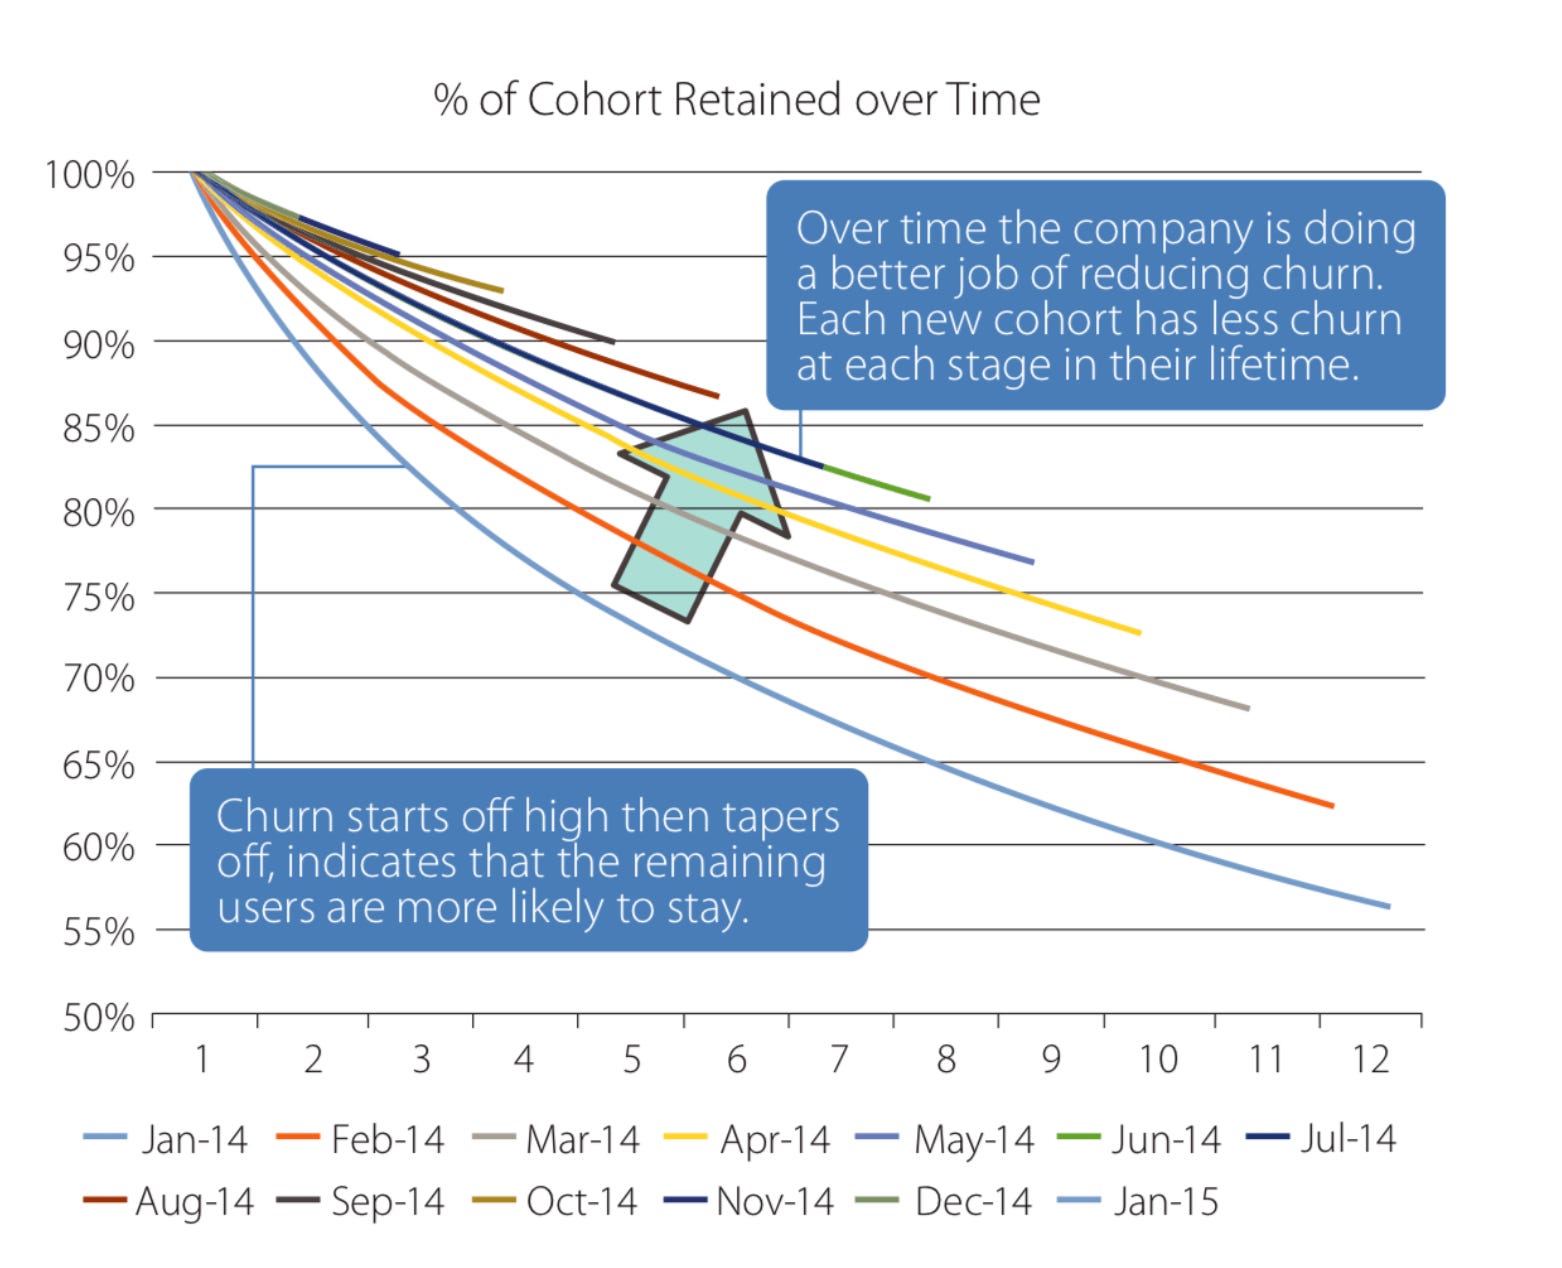
- Do users become more loyal over time? Read a single cohort's row from left to right. Does the churn rate (the drop from one month to the next) slow down? A healthy product often sees a steep initial drop-off, but the remaining users stick around for a long time.
- Is our company getting better at retaining users? Read a column from top to bottom. For example, look at the "Month 3" retention for all cohorts. If the percentages are increasing for newer cohorts (further down the table), it's a great sign! It suggests that improvements to your product, marketing, or onboarding are having a positive effect.
This line chart visualization makes the second point especially clear.
For a deeper dive into interpretation and the types of actions your analysis can trigger, let's return to the comprehensive guide from earlier.
Cohort Retention Analysis: A Comprehensive Guide -
Let's revisit the guide by Cornel Lazar to focus on interpretation. This will help you connect the numbers to business strategy.
Please read the sections 'What to Look for in a Cohort Analysis' and 'Actionable Outcomes of Cohort Analysis'. These sections provide an excellent framework for turning your analysis into a compelling story for stakeholders.
The "Actionable Outcomes" section is particularly relevant for your goal of preparing for BA job interviews. Being able to say, "I saw a large drop-off in Month 2, which suggests we should investigate our onboarding process," is exactly the kind of insight hiring managers look for.
5. Application in Tableau
Finally, to connect this lesson directly to your goal of mastering data visualization for stakeholder presentations, let's see how these same principles apply in Tableau. The process is conceptually identical: identify a customer's first purchase date to define their cohort, and then track their activity over time.
#Tableau - Calculate Customer Retention & Cohort Analysis
Andy Kriebel's tutorial is a quick and effective demonstration of building a cohort analysis in Tableau, a tool you've expressed interest in learning.
Watch the segments showing how to create the 'Customers First Purchase Quarter' (01:01 - 01:54) and 'Retention Rate' (02:27 - 03:07) calculated fields. Notice how the logic is the same as in Excel, but the tool makes the visualization process more fluid.
This demonstrates that once you understand the core logic of cohort analysis, you can apply it in various tools, whether it's Excel, Tableau, or using programming languages like SQL and Python.
Conclusion
You've now learned one of the most fundamental and insightful methods for analyzing user behavior. While we started with simple statistics to describe a static dataset, cohort analysis has allowed us to see a moving picture of how user engagement evolves over time.
Key Takeaways:
- Cohort analysis groups users by a shared characteristic (like sign-up month) to track their behavior over time.
- It's superior to simple metrics because it reveals underlying trends in user loyalty that can be hidden by top-line growth numbers.
- The retention rate is the key metric, calculated by dividing the number of active users in a period by the initial size of their cohort.
- Interpretation is key: Analyze the data horizontally (does a cohort stabilize over time?) and vertically (are newer cohorts better than old ones?) to find actionable insights.
Preview of the Next Lesson:
Cohort analysis is excellent at identifying problems—for example, you might discover that a recent product change led to a sharp drop in retention for new users. But how do you test a potential solution? In our next lesson, you will learn how to formulate a testable hypothesis for an A/B test based on a business problem. This is the primary method businesses use to make data-driven decisions about product and marketing changes.