Hello! Welcome back to our module on Data Visualization and Storytelling with Tableau.
In our last lesson, you did an excellent job learning how to design and build interactive dashboards. You now have the skills to assemble multiple visualizations into a single, cohesive tool and bring it to life with filters and actions.
Today, we will focus on two specific, powerful types of analysis that are frequently featured in such dashboards. Our learning outcome is to use Tableau to visualize and interpret funnel and cohort analysis results. These techniques are essential for any Business Analyst working with product, marketing, or sales data, as they provide deep insights into user behavior and business performance over time.
We'll cover:
- Funnel Analysis: How to visualize and identify bottlenecks in a multi-step process.
- Cohort Analysis: How to track and understand the behavior of groups of users over time.
1. Funnel Analysis: Visualizing User Journeys
Imagine a user's journey on an e-commerce or AdTech platform: they see an ad, click it, visit a landing page, sign up, and finally make a purchase. A funnel chart is the perfect tool to visualize this process, showing how many users progress from one step to the next and, more importantly, where they drop off. Identifying these drop-off points, or "bottlenecks," is a core BA activity that helps businesses optimize their processes.
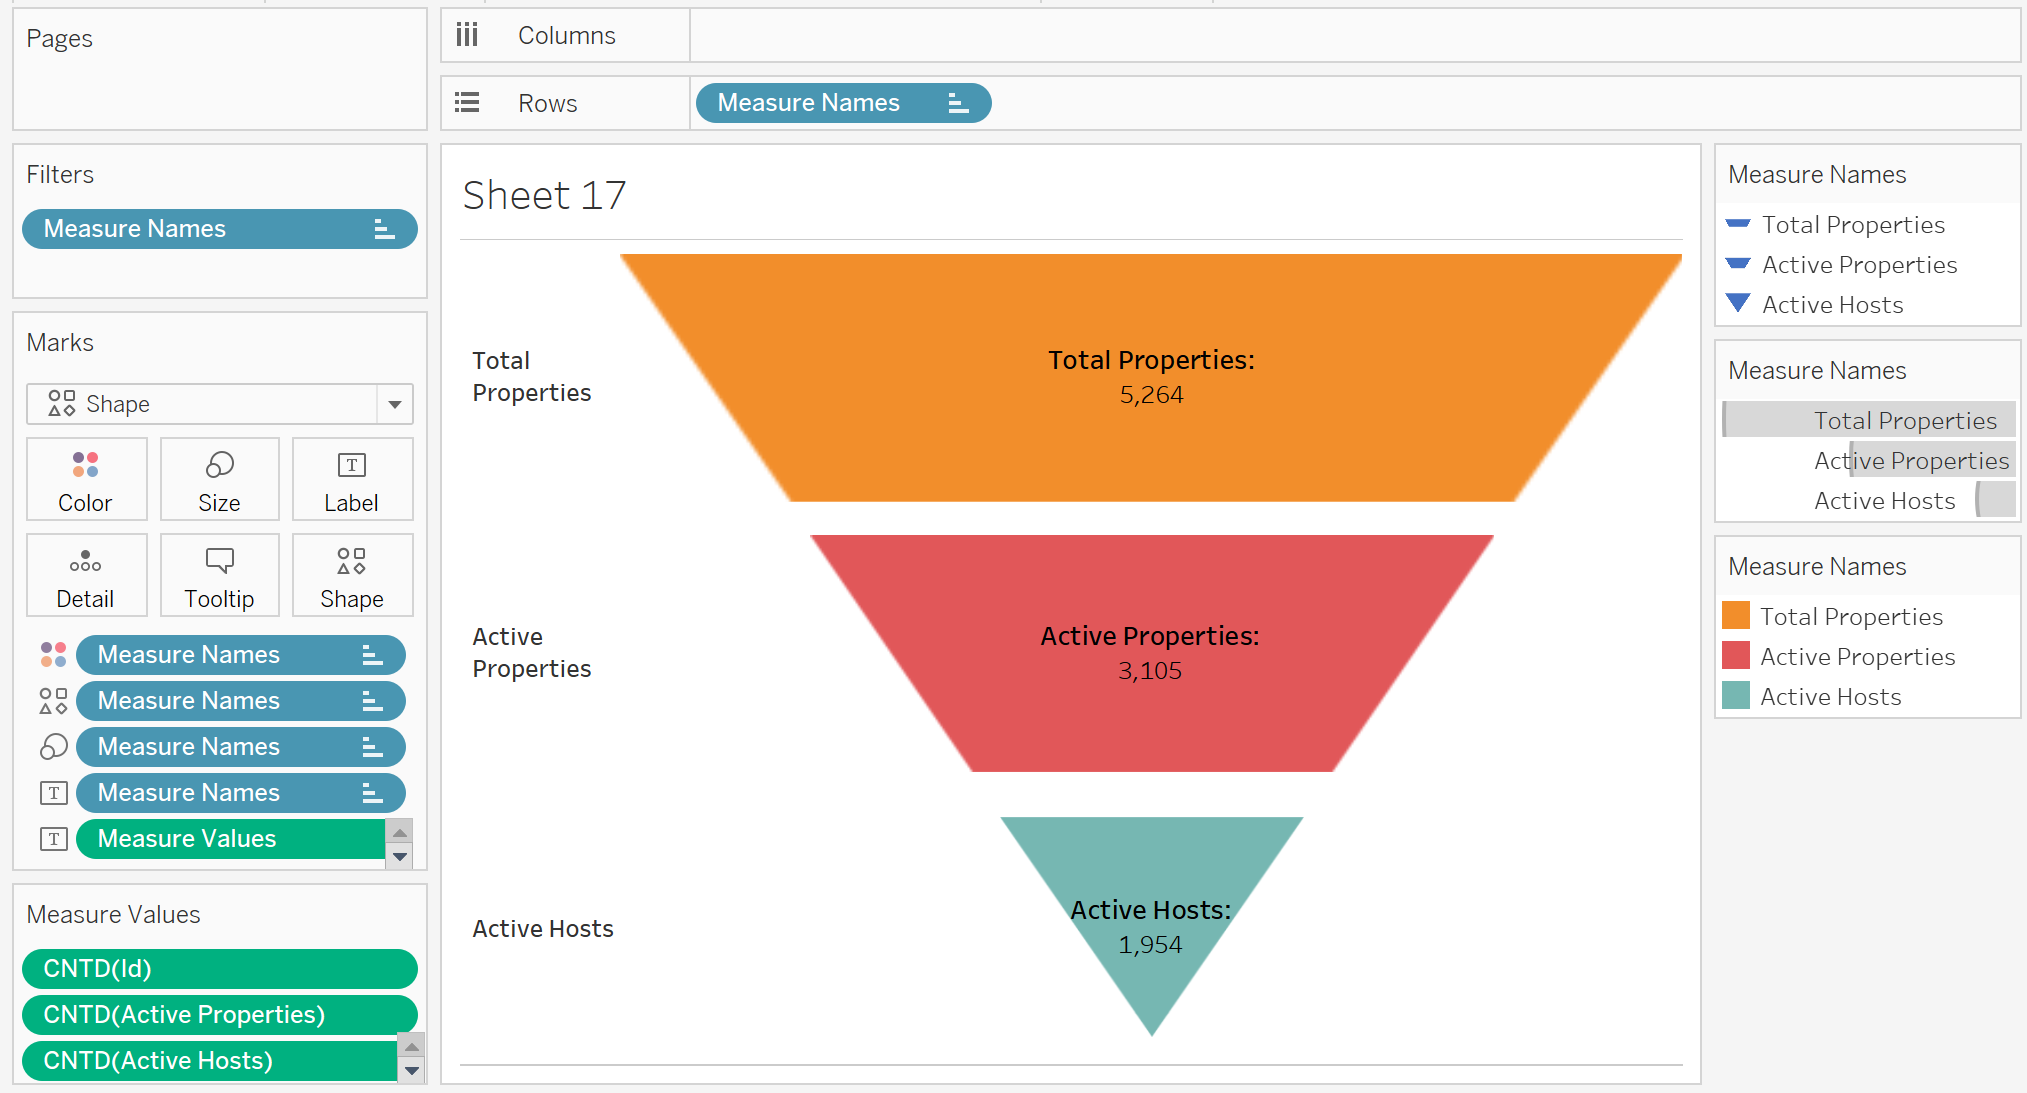
To get a solid grasp of the concept, let's start with a short reading.
Tableau Playbook - Funnel Chart
The article 'Tableau Playbook - Funnel Chart' from Pluralsight provides a clear definition of funnel charts and their use cases. This will give you the foundational theory.
Please read the 'Getting Started' section, including the 'Example' and 'Concept and Characteristics' subsections. Focus on understanding the primary purpose of a funnel chart: visualizing conversion rates and identifying bottlenecks.
Building a Funnel Chart in Tableau
Now let's build one. There are several ways to create a funnel chart in Tableau. We will start with a straightforward and effective method using a stacked bar chart. The following video demonstrates this technique clearly.
The 'TABLEAU FUNNEL CHART TUTORIAL' video from Art of Visualization shows two methods. We will focus on the first, simpler method, which is a great starting point.
Please watch from the beginning to 05:20. Introduction and Data (00:00 - 01:54): Understand the sales cycle data being used as an example. Building the Funnel (01:54 - 05:20): Follow the steps to create the funnel using a bar chart, sort the stages, and add labels showing the percentage of the total. Notice how this simple visualization immediately takes the shape of a funnel.
Interpreting the Funnel Chart
A funnel chart's value comes from the questions it prompts. As a BA, your role isn't just to build the chart, but to analyze it and ask "why?"
Tableau Playbook - Funnel Chart
Let's return to the 'Tableau Playbook - Funnel Chart' article to focus specifically on interpretation.
Read the 'Analysis' subsection within the 'Basic Funnel Chart' section. Pay attention to how the author draws conclusions by identifying the largest drop-off and comparing different channels.
When you present a funnel chart to stakeholders, you guide their attention to the most significant drop-offs. For example, if you see a massive drop between "Sign-up" and "Purchase," you can initiate a discussion to investigate the cause. Is the checkout process too complicated? Is there a technical bug? Are the shipping costs too high? These are the kinds of questions that lead to actionable business improvements.
Test your understanding!
You've created a funnel chart for a new mobile game's user onboarding process with the following stages and user counts:
- Downloaded App: 100,000
- Completed Tutorial: 60,000
- Played First Level: 55,000
- Made In-App Purchase: 5,000
As a Business Analyst, where is the most critical bottleneck, and what initial question would you ask the product team?
Show answer
The most critical bottleneck is between "Played First Level" (55,000 users) and "Made In-App Purchase" (5,000 users). While the first drop-off is large (40%), the drop from playing to paying is far more severe, with over 90% of active players failing to convert.
An initial question for the product team would be: "What is preventing users who complete the first level from making a purchase? We should investigate the perceived value of our in-app purchases and the user experience of the store."
2. Cohort Analysis: Understanding Customer Behavior Over Time
While funnel analysis is great for single processes, cohort analysis is exceptional for understanding user behavior over longer periods. A cohort is a group of users who share a common characteristic, most often the date they first signed up or made their first purchase.
By analyzing cohorts, you can answer critical business questions like:
- Are our newer customers more loyal than our older ones? (Customer Retention)
- Did our big marketing push in Q2 attract customers who stuck around? (Campaign Effectiveness)
- How much of our revenue comes from new vs. returning customers? (Business Health)
This technique moves beyond simple "total sales" charts to reveal deeper trends in customer loyalty and acquisition.

The Concept and Value of Cohort Analysis
To understand the power of this analysis, let's watch a video that perfectly contrasts a simple sales chart with the rich insights a cohort chart provides.
Cohort Analysis in Tableau with Kirill Eremenko
This video, 'Cohort Analysis in Tableau with Kirill Eremenko,' starts with an excellent conceptual overview. It explains why cohort analysis is so valuable for a business.
Watch from 09:39 to 22:59. Focus on the three key applications discussed: Customer Loyalty (Retention): How well are you keeping existing customers? New Customer Acquisition: How effective are you at bringing in new business? Product Funnel Tracking: How do different cohorts move through your product or user experience?
Building a Cohort Chart in Tableau
Building a cohort chart is more technically advanced than a funnel chart. It requires a powerful Tableau feature you learned about in a previous lesson: Level of Detail (LOD) expressions. Specifically, we'll use a FIXED LOD to identify the first purchase date for each customer, which defines their cohort.
The following sections of the same video will walk you through the entire process, from preparing the data to building the final interactive dashboard.
Cohort Analysis in Tableau with Kirill Eremenko
Now, let's get into the practical steps. This part of the tutorial is a masterclass in data preparation and applying LOD expressions—two core BA skills.
Watch from 27:00 to 1:10:04. This is a longer, technical section, so feel free to pause and re-watch as needed. Data Exploration (27:00 - 35:59): Pay close attention to how the presenter investigates the data, particularly the distinction between customer_id and customer_unique_id. This is a realistic example of the data sense-making you'll do as a BA. Creating the FIXED LOD (41:15 - 52:52): This is the most critical technical step. Follow the logic for creating the calculated field that finds the minimum purchase date for each unique customer. This field is the cohort definition. Building the Visualization (53:14 - 1:10:04): See how the LOD expression is used to color the bars, and how table calculations are used to show percentages. The final assembly into a dashboard with an interactive map filter builds directly on what you learned in our last lesson.
This is a challenging but incredibly rewarding visualization to build. Mastering the FIXED LOD expression for cohort analysis is a skill that will set you apart in interviews and on the job.
Conclusion
Excellent work today! You've learned how to build and interpret two of the most insightful visualizations in a Business Analyst's toolkit. These charts move beyond simple reporting to provide deep, actionable insights into business processes and customer behavior.
Key Takeaways:
- Funnel Charts are used to visualize sequential processes, measure conversion rates, and identify bottlenecks where users are dropping off.
- Cohort Analysis is used to track the behavior of user groups over time, providing critical insights into customer retention, loyalty, and the effectiveness of business strategies.
- Building a funnel chart can be done effectively using a stacked bar chart sorted by stage.
- The key to cohort analysis in Tableau is the
FIXEDLevel of Detail (LOD) expression, which allows you to establish a permanent characteristic for each user, like their sign-up month.
Preview of the Next Lesson:
Creating these powerful visualizations is half the battle. The other half is effectively communicating the insights they contain to your stakeholders. In our next lesson, we will learn how to structure a presentation to communicate analysis findings effectively using storytelling. You'll learn how to take a dashboard like the ones you've analyzed today and build a compelling narrative that drives action.