Hello! Welcome to the next lesson in our module on Data Visualization and Storytelling with Tableau.
In our last session, you did a fantastic job learning how to build and interpret funnel and cohort analyses. You now have the technical skills to create visualizations that uncover deep insights into user behavior. However, creating the analysis is only half the job. A Business Analyst's true value lies in their ability to translate those insights into a compelling narrative that persuades stakeholders to act.
Today, we will focus on that exact skill. Our learning outcome is to structure a presentation to communicate analysis findings effectively using storytelling. This is a crucial skill for your goal of transitioning into a formal BA role, as it directly impacts your ability to manage stakeholder communication, present formal findings, and drive business decisions.
We'll cover how to:
- Understand the core components of data storytelling.
- Structure a compelling narrative using professional frameworks like SCQA and the Data Storytelling Arc.
- Find the right story within your data for your specific audience.
- Apply best practices for clarity, simplicity, and impact in your presentations.
1. From Data Visualization to Data Storytelling
The first step is to understand the difference between simply showing data and telling a story with it. A chart shows what happened. A story explains why it happened, what it means, and what should be done about it.
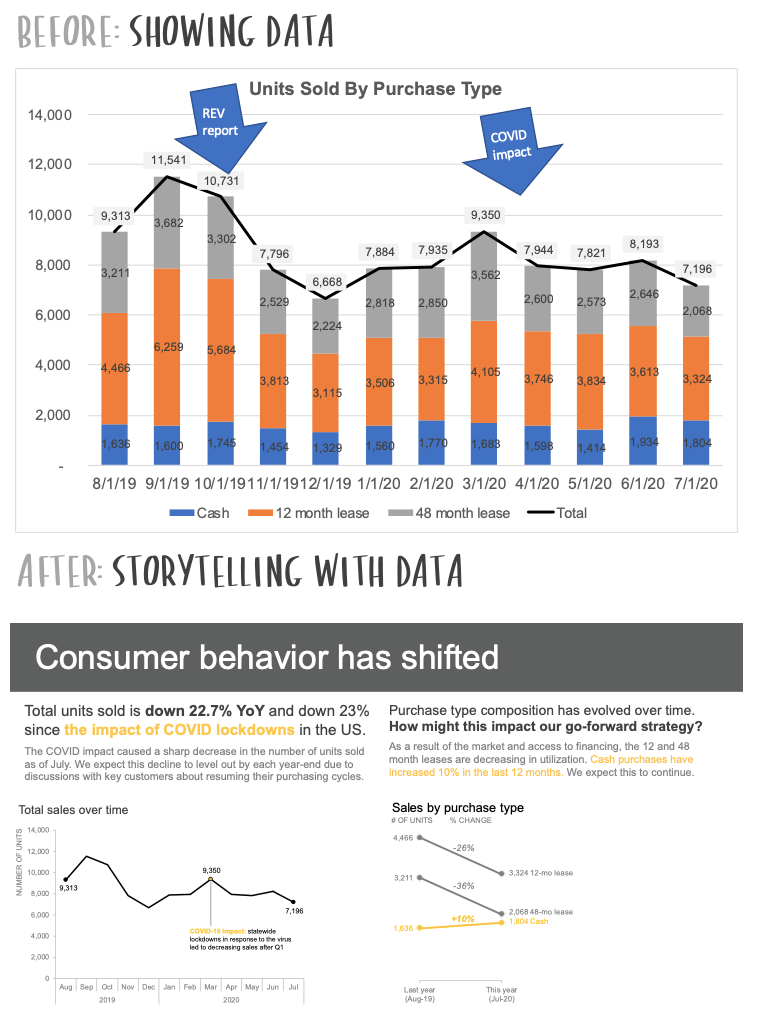
Look at the image below. The "Before" is a standard, data-heavy chart. It's informative but requires the audience to do all the work of interpretation. The "After" transforms that data into a clear, compelling narrative with annotations and simpler visuals that guide the audience directly to the key insights. This is our goal.
To solidify this distinction, let's watch a short video that defines data storytelling.
Data Storytelling 101 | Think Like a Data Analyst
The video 'Data Storytelling 101' by Christine Jiang starts with a perfect, concise explanation of what data storytelling is and how it differs from data visualization.
Please watch from 00:58 to 01:49. Focus on the example given: moving from 'here's a graph of sales trends' to 'sales have dropped... this is driven by X... and we should investigate why'.
As the video highlights, data storytelling is a blend of three essential components:
- Data: The accurate, analyzed facts that form the foundation of your argument.
- Visuals: The charts and graphs (like the ones you built in Tableau) that illuminate the data.
- Narrative: The story that weaves the data and visuals together, providing context and meaning.
2. Structuring Your Presentation's Narrative
A good story needs a solid structure. In a business context, you can't just start presenting charts. You need to frame the problem and then guide your audience through your analysis logically. We will look at two powerful frameworks used by top consulting firms.
Framework 1: The SCQA Framework for Your Introduction
Your presentation's introduction needs to grab the audience's attention and establish why they should care. The SCQA framework is perfect for this. It stands for:
- Situation: The current state of affairs; the established context. ("We are a leading AdTech platform for mobile game advertisers.")
- Complication: The change or challenge that has occurred, creating a problem or opportunity. ("However, our new user conversion rate has dropped by 15% in the last quarter.")
- Question: The specific question that the complication raises, which your analysis will answer. ("This leads us to ask: what is driving this drop in conversion?")
- Answer: The high-level summary of your main finding or recommendation. This is your core message. ("Our analysis reveals the drop is primarily due to poor ad performance on one specific social media channel.")
This framework sets the stage in a clear, logical way. The following video explains this concept in detail.
PowerPoint Storytelling: How McKinsey, Bain and BCG create compelling presentations
The video 'PowerPoint Storytelling' from Analyst Academy explains how consulting firms like McKinsey and BCG structure their presentations. The first part focuses on the SCQA framework.
Please watch from the beginning to 04:44. Pay attention to how the SCQA framework provides context and creates a narrative hook before diving into the data. The BCG example is particularly insightful.
Framework 2: The Data Storytelling Arc for Your Main Body
Once you've set the stage with SCQA, you need a structure for the main body of your presentation. The Data Storytelling Arc provides an excellent narrative flow.
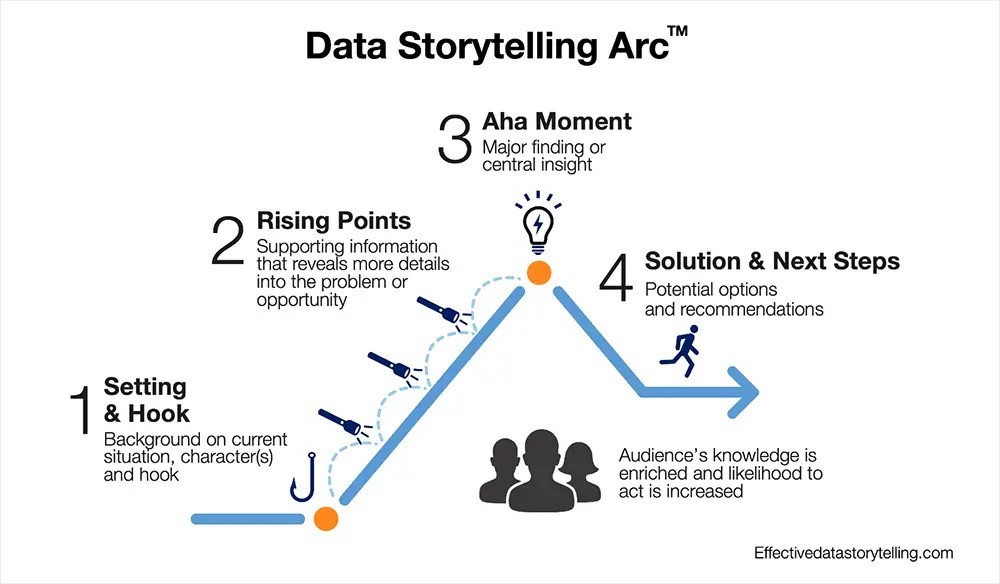
This arc can be broken down into five parts, which will form the slides or sections of your presentation:
9 Data Storytelling Tips for More Effective Presentations
The article '9 Data Storytelling Tips for More Effective Presentations' from NetSuite outlines a practical five-part structure for a business story. This complements the visual arc perfectly.
Please read section '3. Outline the Story', focusing on the five-part structure provided: Establish context, Embed the 'hook', Tease out insights, Reveal the core message, and Sound the call to action.
Notice how the SCQA framework naturally feeds into this arc. The Situation and Complication from SCQA establish the context and hook. The body of your presentation then walks through the Rising Points (your supporting data) to the Aha Moment (your core finding), leading to the Solution & Next Steps (your recommendation or call to action).
Test your understanding!
Imagine you're a BA at an AdTech company. You've noticed that while overall ad spend from clients is up, the click-through rate (CTR) on a major ad format has declined. Using the SCQA framework, how would you structure the opening of a presentation to your product team?
Show answer
- Situation: Our platform's total ad spend from clients grew by 10% in the last quarter, which is a great achievement.
- Complication: However, we've observed that the click-through rate (CTR) for our flagship 'Video-Plus' ad format has simultaneously declined by 20%, threatening future client satisfaction and revenue.
- Question: This raises the critical question: What factors are causing the decline in CTR for the 'Video-Plus' format?
- Answer: Our initial analysis suggests that the decline is concentrated among mobile users on Android devices, pointing towards a potential rendering issue or a recent OS update conflict.
3. Finding the Story in Your Data
A structure is useless without a story to put inside it. As a BA, you must explore your data to find that story. This process involves two key steps: understanding your audience and identifying the right story type.
Know Your Audience
A story that resonates with the engineering team might not work for the CEO. Before you build your presentation, ask yourself:
- Who is my audience? (e.g., CMO, Head of Product, Engineering Lead)
- What do they care about? What are their goals and "pain points"?
- How much detail do they need?
- What action do I want them to take?
9 Data Storytelling Tips for More Effective Presentations
Let's return to the '9 Data Storytelling Tips' article, which offers excellent advice on tailoring your message.
Read tip '1. Adjust the Message for the Audience'. The example about the toy company is a great illustration of how the same data can be used to tell different stories to different stakeholders (the CMO vs. the CEO).
Identify the Story Type
Once you know your audience, you can choose a narrative angle. The Tableau resource "Best Practices for Telling Great Stories" outlines several common data story types.
Best Practices for Telling Great Stories
This resource from Tableau provides a helpful menu of story archetypes. Thinking about which type fits your data can help you structure your analysis.
Read the section 'The seven types of data stories' and review the table. Think about how the analyses you learned in the last lesson (funnel and cohort) might fit into these types.
For instance:
- A cohort analysis naturally tells a "Change Over Time" story about user retention.
- A funnel analysis often uses a "Drill Down" approach to find the specific step where a bottleneck occurs.
- Comparing the performance of two different ad campaigns is a "Contrast" story.
The following video provides a practical walkthrough of this exploration process in Tableau, showing how to start with a high-level question and "drill down" to find the story.
Data Storytelling 101 | Think Like a Data Analyst
Let's watch Christine Jiang's Tableau demo again. This time, focus on how she explores the data—moving from the overall trend to different dimensions like marketing channel, product, and region—to uncover the narrative.
Please watch from 01:49 to 06:21. Notice how each drill-down either confirms or refutes a hypothesis, slowly building the story of why sales declined.
4. Best Practices for Clear and Compelling Slides
With your structure and story in hand, the final step is to design your slides for maximum clarity and impact.
- Use Story-Driven Titles: Instead of a descriptive title like "Sales by Quarter," use an insightful one like "Q3 Sales Spike Driven by New Product Launch." This follows the Pyramid Principle: state your conclusion first, then show the data that supports it.
- Prioritize Clarity Over Coolness: Simple, clean charts (like bar and line charts) are often more effective than complex, flashy ones. Your goal is to communicate, not to impress. Avoid pie charts, as they make it difficult to compare values and see trends over time.
- Use Color with Purpose: Use color intentionally to highlight key data points, not for decoration. A neutral palette with a single, bright color to draw attention is highly effective.
- Keep It Simple: Each slide should have one main idea. Remove any unnecessary clutter—gridlines, legends, or labels—that doesn't support your point.
This video section summarizes these do's and don'ts perfectly.
Data Storytelling 101 | Think Like a Data Analyst
This final clip from 'Data Storytelling 101' offers crucial, practical advice for designing your visualizations.
Watch from 09:26 to 12:44. Pay close attention to the tips on avoiding pie charts, using story-driven titles, and using color intentionally.
Conclusion
Great work today! You've learned how to move beyond being a data analyst to becoming a data storyteller. This is a skill that will differentiate you as a Business Analyst, enabling you to influence decisions and demonstrate strategic value.
Key Takeaways:
- Data storytelling combines data, visuals, and narrative to explain why something is happening and what to do about it.
- Use the SCQA framework (Situation, Complication, Question, Answer) to structure a powerful introduction that grabs your audience's attention.
- Organize the body of your presentation using the Data Storytelling Arc (Setting, Rising Points, Aha Moment, Solution).
- Always tailor your story to your audience's needs and choose a story type (e.g., Drill Down, Contrast) that fits your analysis.
- Craft your slides with clarity and simplicity in mind, using story-driven titles and purposeful design.
Preview of the Next Lesson:
You now have the framework for structuring a compelling data story. In our final lesson of this module, you will put it all into practice. The learning outcome is to present a data-driven recommendation to a business stakeholder based on a Tableau dashboard. We will focus on the delivery, tone, and handling questions to ensure your analysis leads to real business action.