Hello! Welcome to the final lesson in our module on Data Visualization and Storytelling with Tableau.
In our last session, we laid the theoretical groundwork for effective communication, covering how to structure a presentation using narrative frameworks like SCQA and the Data Storytelling Arc. You learned how to find the story within your data and design clear, compelling visuals.
Today, we move from structure to action. The goal of any analysis in a business setting is to drive change, and that requires more than just presenting findings—it requires making a clear, data-driven recommendation. Our learning outcome is to present a data-driven recommendation to a business stakeholder based on a Tableau dashboard. This is the capstone skill for this module and a critical competency for any Business Analyst, directly tying into your goals of improving stakeholder communication and preparing for BA job interviews.
We will focus on:
- Translating data insights into actionable business recommendations.
- Designing a dashboard that persuasively guides your stakeholder toward your recommendation.
- A step-by-step process for building and presenting your recommendation.
1. From Insight to Recommendation: Answering "So What?" and "Now What?"
In the last lesson, we focused on uncovering the "aha moment" in your data. Now, you must connect that moment to a business outcome. An insight is an observation, but a recommendation is a call to action.
- Insight: "Sales have dropped 30% in the last six months." (The what)
- Implication: "This is impacting our quarterly revenue targets and may signal a loss of market share." (The so what?)
- Recommendation: "We should investigate the root cause by analyzing regional and product-level performance to form a recovery plan." (The now what?)
A great presentation or dashboard makes this entire chain of logic explicit. The final step of your data story should always be a clear recommendation that answers the "now what?" question for your stakeholders.
Tableau Story Example: Sales Performance Analysis
The article 'How to Visualize Complex Data with Tableau Storytelling' provides a practical example of how a Tableau story is structured to build towards a recommendation.
Please read the section 'Tableau Story Example: Sales Performance Analysis'. Notice how the story progresses from a high-level overview to breakdowns and finally culminates in 'Key Insights & Recommendations: Strategic Decision-Making'. This is the structure you should aim for.
2. Building a Persuasive Dashboard
Your Tableau dashboard is not just a report; it's a persuasive document. When presenting a recommendation, you should design the dashboard to guide your audience to your conclusion. The goal is to make your recommendation feel like the obvious, logical next step based on the evidence.
Look at the dashboard example below. It doesn't just display metrics. It has dedicated sections for "Real Insights," "Real Actions," and "Real Impact." This is a best practice for transforming a dashboard from a passive monitoring tool into an active decision-making tool.
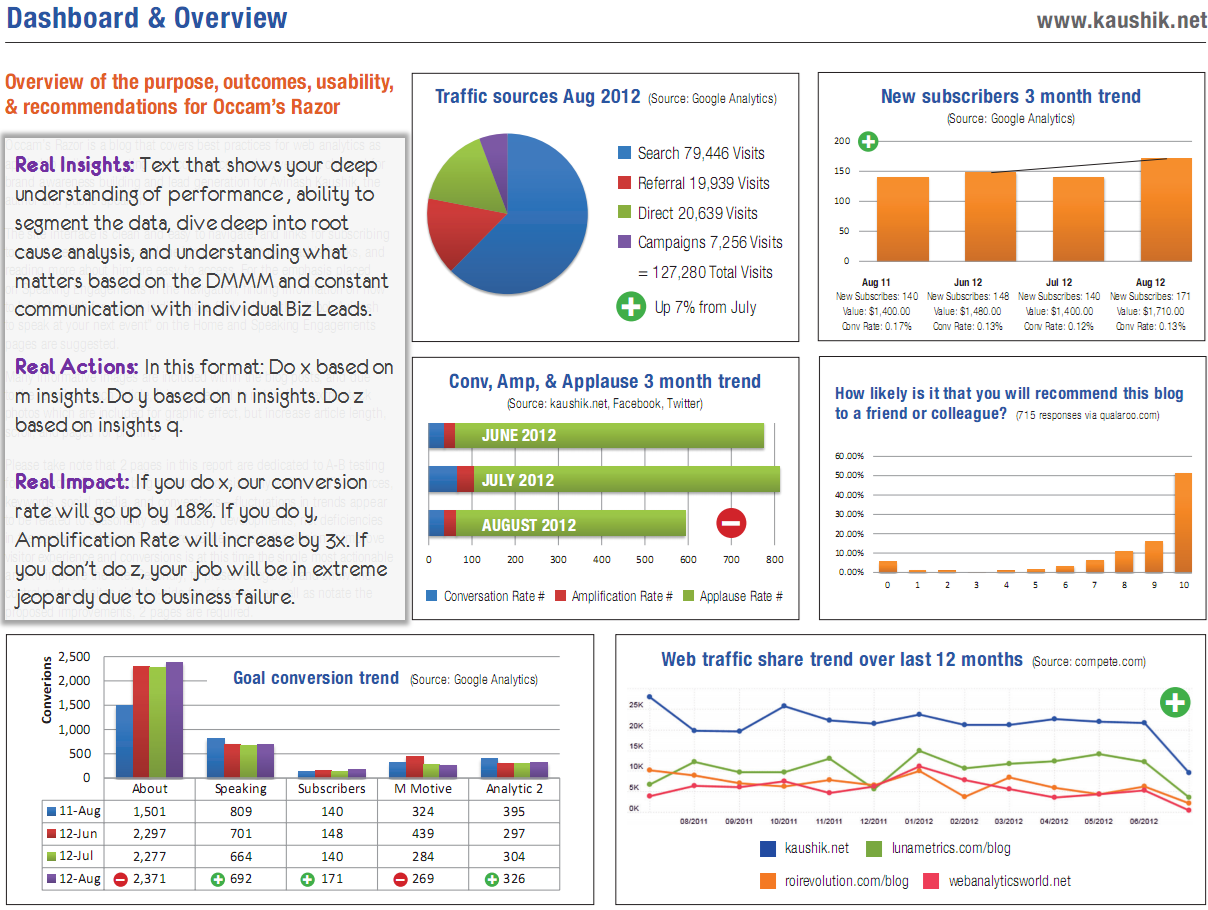
To learn how to build such a dashboard, we will follow a structured, six-step process.
Telling a Story with Data | Dashboard Build Demo
The video 'Telling a Story with Data' from Maven Analytics provides an end-to-end demonstration of building a dashboard designed for storytelling and decision-making. We'll watch it in parts to break down the process.
First, watch from the beginning (00:22) to 04:02. This will introduce the six-step framework and the case study we'll be following. Pay close attention to the six steps, as they provide a clear roadmap for your work.
As the video outlines, the six steps are:
- Define the purpose: Know your audience and what they need to decide.
- Choose the right metrics: Select data that directly addresses the business goals.
- Present the data effectively: Pick the right charts for the job.
- Eliminate clutter and noise: Simplify for clarity.
- Use layout to focus attention: Guide the viewer's eye.
- Tell a clear story: Use text to craft a narrative and state your recommendation.
Now, let's see how these steps are applied to build a dashboard that leads to a recommendation.
Telling a Story with Data | Dashboard Build Demo
This next segment shows the entire process in action, from defining metrics to arranging the final dashboard.
Watch from 04:02 to 12:49. This is the core of the lesson. Observe carefully how the presenter: Chooses metrics based on business goals (04:02-06:18). Refines visuals to eliminate clutter and uses color strategically (06:18-08:59). Uses layout (like the 'Z' pattern) and design principles (like enclosure) to create a logical flow and focus attention (08:59-12:49). Transforms chart titles from descriptive to prescriptive, telling a story.
The final step shown in the video is crucial: adding specific insights and recommendations. This elevates the dashboard from a report to a decision-making tool.
Telling a Story with Data | Dashboard Build Demo
Let's watch the very end of that segment again to focus on the most important part.
Watch from 12:37 to 13:03. Notice how the presenter concludes by listing specific, actionable recommendations based on the data presented in the dashboard.
3. Best Practices for Your Presentation
When you present your dashboard, your verbal delivery should reinforce the story you've built visually. Here are some key best practices to tie everything together.
- Start with the goal: Before you even open Tableau, define the single message you want to get across. All your design choices should serve this one goal.
- Know your audience: Your presentation to a project manager will be different from one to a marketing executive. The project manager might care about the resources needed for your recommendation, while the executive cares about the potential ROI.
- Combine words with visuals: The most powerful technique from the Maven Analytics video was replacing generic chart titles with story-driven headlines. For example, instead of "Revenue by Product," use "Art Supplies & Games Drove 80% of Revenue Growth."
Mastering Data Storytelling with Tableau
The article 'Mastering Data Storytelling with Tableau' offers some excellent, concise advice that reinforces these points.
Please read the short sections titled 'Understand the Goal Before You Start', 'Know Who You Are Talking To', and 'Combine Words With Charts'. These reinforce the core principles of planning and communication.
Test your understanding!
You're presenting a dashboard to a marketing manager in your AdTech company. Your analysis shows that a recent campaign performed poorly. Which of the following is the most effective title for your main chart?
- "Campaign Performance"
- "Click-Through Rate (CTR) by Ad Creative"
- "New 'Summer Splash' Campaign Underperformed by 30% vs. Benchmark"
- "Ad Creative A: 1.2% CTR, Ad Creative B: 1.1% CTR, Ad Creative C: 0.3% CTR"
Show answer
Option 3 is the best choice. It's a story-driven title that immediately communicates the key insight and its business context (the "so what"). Option 1 is too vague. Option 2 is a good description but lacks the key insight. Option 4 provides data but forces the audience to do the interpretive work.
Conclusion
You have now completed the journey from raw data to a persuasive, data-driven recommendation. By combining the narrative structures from our last lesson with the practical dashboard design and presentation techniques from today, you have a powerful toolkit to influence stakeholders and drive business decisions. This is a skill that will set you apart in your transition to a Business Analyst role.
Key Takeaways:
- A complete data story must answer "What?", "So what?", and "Now what?". Your final output should always be an actionable recommendation.
- Design your Tableau dashboard as a persuasive tool, using layout, color, and annotations to guide your stakeholder to your conclusion.
- Follow a structured process: Define purpose, choose metrics, design visuals, eliminate clutter, use layout, and tell a story with text.
- Story-driven headlines are one of the most effective ways to communicate your key message quickly and clearly.
Preview of the Next Module:
Congratulations on completing the module on Data Visualization and Storytelling! You've built a strong foundation in a critical BA "hard skill."
In our next module, "Business Analysis in an Agile Context," we will shift focus. You'll learn how the role of a Business Analyst operates within modern software development teams. Our first lesson will cover the role and responsibilities of a Business Analyst in Agile and Scrum teams. This will bridge your new analytical skills with the day-to-day processes and collaborations you'll encounter in an IT environment.