Hello! Welcome back to our module on Data Visualization and Storytelling with Tableau.
In our last lesson, you learned how to create calculated fields, which is a fundamental skill for creating custom metrics that don't exist in your original dataset. You can now move beyond basic fields and invent your own KPIs, like Profit Margin or custom customer segments.
Today, we'll put that skill to use as we move from creating individual charts to building a complete, cohesive, and dynamic reporting tool. Our learning outcome is to design and build an interactive dashboard with filters and actions.
This is the moment where all your work comes together to deliver value. A single chart might answer a single question, but a well-designed interactive dashboard empowers business stakeholders to explore the data and answer their own questions. For a Business Analyst, this is one of your most visible and impactful deliverables.
We'll cover:
- The importance of designing a dashboard before you build it.
- The practical steps of assembling multiple worksheets into a dashboard.
- Making your dashboard dynamic with filters and actions.
1. The Design Phase: Planning for Impact
Before dragging and dropping a single chart, a great analyst thinks about the story the dashboard needs to tell and the user who will be consuming it. A rushed, cluttered dashboard is often worse than no dashboard at all. The first step is to create a simple plan or wireframe.
Given your background in project and account management, you know that presenting information clearly to busy executives is critical. A wireframe is a simple layout sketch that helps you organize your visualizations logically.
The following article provides a fantastic, real-world example of designing a dashboard specifically for the AdTech space.
Step-by-Step Guide to Designing an Ads Performance ...
This article, 'Step-by-Step Guide to Designing an Ads Performance...', is highly relevant to your background. We'll start by focusing on the initial design and wireframing phase.
Please read the introduction and 'Step 2: Wireframe for User-Centric Design'. Pay close attention to the two design principles and the example dashboard wireframe. Think about how this structured approach helps organize information for a marketing manager.
As the article notes, the key principles are simple but powerful:
- Information Hierarchy: Place the most important, high-level information (like KPIs) at the top or top-left. The user's eye naturally goes there first.
- Logical Flow: Arrange the charts to tell a story or guide the user through an analytical process, moving from summary to detail.
- Accessibility: Place interactive elements like filters where users can easily find them.
2. The Build Phase: Assembling Your First Dashboard
Now that you understand the importance of design, let's get hands-on and build a complete dashboard. We'll use a video tutorial that walks through the entire process, from creating a few quick charts to arranging them in a professional layout.
Tableau Tutorial for Beginners | Create Your First Dashboard
This tutorial by Andy Kriebel is a classic for a reason. It's a fast-paced but clear guide to building your first dashboard. Follow along with Tableau Desktop if you can.
Watch the video from 04:05 to 10:23. Building the Sheets (04:05 - 07:51): This part quickly builds the worksheets we'll use. You've done this before, so focus on how each chart is constructed to answer a different question. Assembling the Dashboard (07:51 - 10:23): This is the core of this section. Pay close attention to how he uses horizontal containers to organize the worksheets and how he formats the titles and borders to create a clean layout.
After this, you will have a static dashboard. It looks good, but it doesn't do anything yet. The next step is to bring it to life with interactivity.
3. Making It Interactive: Filters and Basic Actions
The most common way to add interactivity is to allow users to filter the data. A filter action lets you use one sheet in your dashboard to filter the data in other sheets.
The simplest way to enable this is with the "Use as Filter" option.
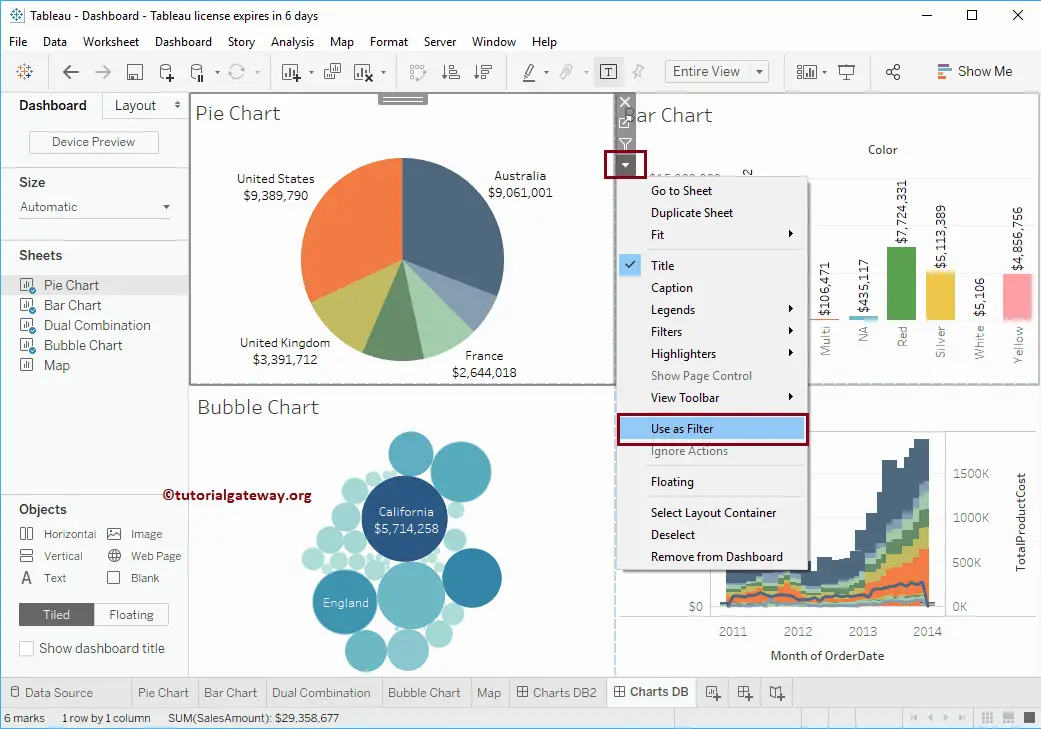
Now, let's see this in action to complete our first interactive dashboard.
Tableau Tutorial for Beginners | Create Your First Dashboard
Let's watch the final part of the same video, where Andy Kriebel makes the dashboard interactive in just a few clicks.
Watch from 10:23 to 11:11. Notice how after he clicks 'Use as Filter' on each sheet, clicking a data point (like a year, a state, or a product) automatically updates all the other views.
When you click that "Use as Filter" button, Tableau is actually creating a Dashboard Action for you in the background. Let's pull back the curtain and see how we can configure these actions with more precision.
4. Advanced Interactivity: The Power of Dashboard Actions
The "Use as Filter" shortcut is great for quick dashboards, but for more sophisticated analysis, you'll need more control. You might want a click to filter only some of the charts, or you might want the action to trigger on a mouse-over instead of a click.
This is all done through the Actions menu.
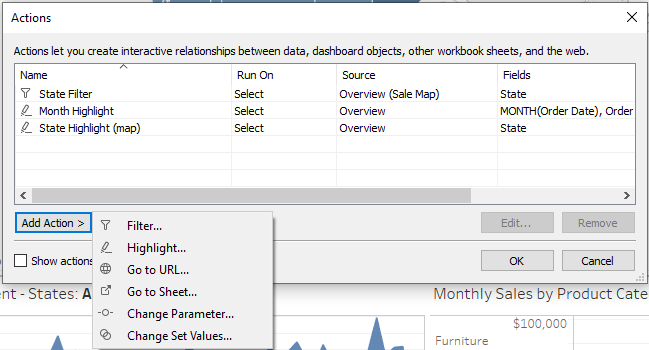
The next video provides a fantastic deep-dive into the Actions menu, explaining the different settings you can control.
Introduction to Tableau Actions + Filter Actions demos + BONUS Topics
The sqlbelle channel offers a detailed look at Tableau Actions. This will explain the theory behind what 'Use as Filter' does and show you how to customize it.
Watch from the beginning to 14:09. The video covers several key concepts: Types of Actions (00:00 - 04:53): Get an overview of all the action types available (Filter, Highlight, Go to URL, etc.). 'Use as Filter' Explained (06:07 - 08:58): See how this shortcut creates a default filter action. Editing the Action (08:58 - 12:08): This is crucial. Understand the difference between Run action on: Select (click), Hover (mouse-over), and Menu (tooltip link). Targeting and Clearing (12:08 - 14:09): Learn how to make an action affect only specific Target Sheets and what happens when you clear the selection.
Test your understanding!
A stakeholder wants to click on a state in a map visualization. This click should filter a bar chart showing sales by product for that state, but it should not affect a line chart showing the overall sales trend for the entire country over time.
How would you configure the Filter Action to achieve this?
Show answer
In the Actions dialog box, you would:
- Set the Source Sheet to be the map visualization.
- In the Target Sheets section, you would select the bar chart showing sales by product.
- You would make sure the line chart showing the national sales trend is unchecked in the Target Sheets list.
This ensures the action originating from the map only affects the intended target, leaving the other charts on the dashboard unchanged.
5. An Advanced, Domain-Relevant Example: Parameter Actions
Filter actions are just one type of interactivity. A more advanced technique involves combining Parameters and Parameter Actions. This lets you build very intuitive controls, like custom buttons that change the entire dashboard's context.
Let's return to the AdTech dashboard article, which demonstrates how to create buttons to switch between different date ranges (e.g., "Last 7 days," "Last 14 days"). This is an extremely common requirement in performance marketing dashboards.
Step-by-Step Guide to Designing an Ads Performance ...
Now we'll explore a more advanced type of interactivity using your AdTech dashboard example. This section explains how to use 'Parameter Actions' to create dynamic date filters.
Read 'Step 4: Implementing Dynamic Date Filtering' and 'Step 5: Enabling Parameter Actions for User Interaction'. Don't worry about memorizing the complex CASE statement formula. Instead, focus on the overall mechanism: A Parameter is created to hold the selected time period (e.g., 'This Week'). A special worksheet is created to act as the buttons. A Parameter Action is configured so that when you click a 'button' on that sheet, it changes the value of the Parameter. A Calculated Field (the [Date Filter]) uses the parameter's current value to filter all the sheets.
This technique is powerful because it's not just filtering existing data—it's changing a core variable (Parameter) that can be used in many different calculations throughout the entire workbook, giving you immense flexibility.
Conclusion
Fantastic work! You have now bridged the gap between creating individual charts and delivering a professional, interactive business intelligence tool. This is a skill that is central to the role of a modern Business Analyst.
Key Takeaways:
- Design First: Always start with a wireframe to plan your dashboard's layout and story.
- Assemble with Containers: Use horizontal and vertical containers to organize your worksheets into a clean, logical grid.
- Start with "Use as Filter": This is the quickest way to add basic, powerful interactivity to your dashboards.
- Master the Actions Menu: For fine-tuned control, use the Actions menu to specify source/target sheets, trigger methods (
Select,Hover,Menu), and clearing behavior. - Leverage Parameter Actions: For advanced interactivity like custom navigation or dynamic date ranges, combine parameters with parameter actions.
Preview of the Next Lesson:
Now that you can build interactive dashboards, we'll focus on creating more sophisticated analytical views to put inside them. In the next lesson, we will focus on how to use Tableau to visualize and interpret funnel and cohort analysis results. These are critical analysis techniques for understanding user behavior and conversion, especially in areas like digital marketing and product analytics.