Hello! Welcome to the first lesson in our module on Data Visualization and Storytelling with Tableau.
In our previous module, you did excellent work mastering pandas to clean, manipulate, and combine datasets. You now have the skills to prepare a high-quality, analysis-ready dataset from various files. However, a table of numbers, no matter how clean, rarely speaks for itself. The true power of a Business Analyst lies in translating that data into a compelling story that drives decisions. That's where Tableau comes in.
This lesson kicks off your journey into data visualization. Before you can build a single chart, you must get your data into the tool. Therefore, today's learning outcome is to connect to various data sources and import data into Tableau. This is a foundational skill, enabling you to access the information you need, whether it's in a simple Excel file from the finance department or a complex company-wide database.
1. The Tableau Connection Landscape
Tableau is designed to be a central hub for data analysis, and as such, it can connect to an incredibly wide array of data sources. As a Business Analyst, you'll find data living in many different places, and you'll need to be comfortable connecting to the most common ones.
Connecting to Data Sources in Tableau: A Guide
To start, let's get a high-level overview of the types of data sources Tableau supports. This brief reading from Salesforce Trailhead sets the stage for what's possible.
Read the sections 'What Types of Data Can You Connect to in Tableau?' and 'Explore Data Connectors'. Pay attention to the three main categories: files, servers, and cloud sources. The image shows you exactly where to find these options on Tableau's start page.
The key takeaway is that Tableau uses built-in, optimized connectors for different data types. You simply select the connector that matches your data source, whether it's a flat file like a CSV or a server-based database.
2. Connecting to Files: CSV and Excel
The most common data sources you'll encounter, especially when receiving data from colleagues or exporting it from web platforms, are files. Excel spreadsheets and Comma-Separated Values (CSV) files are ubiquitous in the business world. For example, you might export weekly campaign performance data from an AdTech platform as a CSV, or receive a budget forecast from a project manager as an Excel file.
The following video provides a fantastic, step-by-step guide to connecting to these file types.
How to Connect to Different Data Sources in Tableau: A beginner's guide
This video from the 'Data with Tableau Tim' YouTube channel is a great practical walkthrough. We'll focus on connecting to a CSV file and then an Excel file.
Watch from 00:40 to 23:30. The presenter will cover: Connecting to a Text (CSV) file (00:40 - 14:21): Observe how he selects the 'Text file' connector and how Tableau displays the data in the 'Connection Interface'. Pay close attention to the process of checking and changing data types (e.g., from a string to a date). This is a critical data validation step. Connecting to an Excel file (14:22 - 23:30): Notice how Tableau can see the different sheets or named ranges within a single Excel workbook. This is a common scenario you will face.
After connecting, you land on the Data Source page. This page is your command center for preparing data. It shows you a preview of your data, lists the fields (columns), and allows you to inspect and correct the metadata—the data about your data, such as field names and data types (e.g., Number, String, Date). Getting the data types right is essential for correct analysis later on.
3. Connecting to Databases: The Single Source of Truth
While files are common, most mature organizations store their core business data in databases. As a BA, connecting directly to a database is preferable because it ensures you are working with the official "single source of truth," which is scalable and up-to-date.
Connecting to a database requires a few more pieces of information than opening a file.
This article clearly explains the benefits of connecting to a database and lists the credentials you'll typically need. Understanding this is important for communicating with IT or data engineering teams.
Read the sections 'Why Connect SQL to Tableau?', 'What You'll Need Before You Start', and the step-by-step guide. Focus on understanding the value of a direct database connection and familiarize yourself with the required credentials (Server Name, Database Name, Port, etc.).
Now, let's see what this looks like in practice. The next clip from the video you watched earlier demonstrates connecting to a modern cloud database.
How to Connect to Different Data Sources in Tableau: A beginner's guide
We'll return to Tableau Tim's guide to see the database connection process in action. He uses Snowflake, a popular cloud data warehouse.
Watch from 23:48 to 28:10. You don't need to memorize the specifics for Snowflake. Instead, focus on the general workflow: selecting the server connector, providing credentials, and then selecting the specific database, schema, and tables you want to analyze.
4. The Critical Choice: Live Connection vs. Extract
Once you've connected to a data source, Tableau gives you a crucial choice: use a Live Connection or create an Extract. This decision affects your dashboard's performance, data freshness, and portability.
- Live Connection: Tableau sends queries directly to the source database or file every time you interact with a visualization (e.g., apply a filter). This is great for real-time data but can be slow if the underlying database is not optimized.
- Extract (.hyper file): Tableau takes a snapshot of the data and imports it into its own high-performance, in-memory data engine. This makes dashboards much faster and allows you to work offline, but the data is only as fresh as your last refresh.
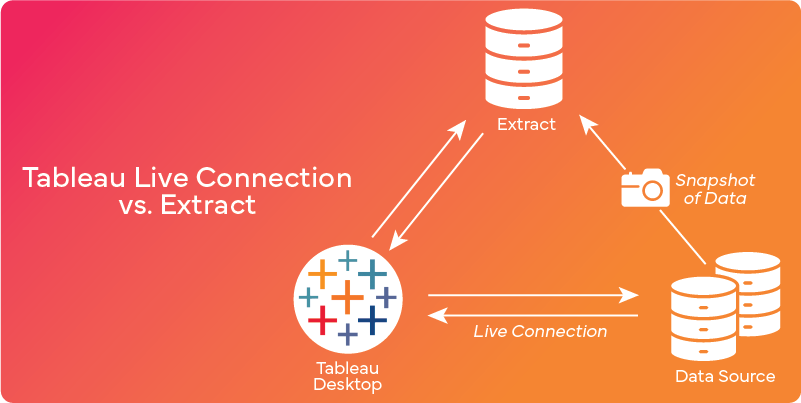
For most analytical purposes, especially when building dashboards for presentation, starting with an Extract is a best practice. It ensures a smooth, fast user experience for your stakeholders.
The final segment of the video demonstrates how to create an extract and, crucially, how to save your work as a Packaged Workbook (.twbx). A .twbx file bundles your Tableau workbook with the data extract and any custom images, making it a self-contained file you can easily share with colleagues.
How to Connect to Different Data Sources in Tableau: A beginner's guide
Let's see how to manage extracts and save your work correctly.
Watch from 28:10 to 38:38. This is a very important section. Focus on understanding: The concept of a data 'snapshot'. The process of switching from 'Live' to 'Extract'. The difference between a Tableau Workbook (.twb) and a Tableau Packaged Workbook (.twbx). As a BA who needs to share analyses, you will almost always use .twbx.
Test your understanding!
You are building a dashboard for the executive team that summarizes last quarter's advertising spend and performance. The data is in your company's main database. The dashboard needs to be fast and responsive during the presentation, and you won't have a direct connection to the company network in the conference room.
Should you use a Live connection or an Extract? Why?
Show answer
You should use an Extract.
Reasoning:
- Performance: An extract will ensure the dashboard is fast and responsive during the presentation, which is critical when presenting to executives.
- Portability/Offline Access: Since you won't have a network connection, a live connection would fail. An extract is saved within your workbook file, allowing you to open and present it anywhere.
- Data Freshness: The data is for the previous quarter, so real-time updates are not necessary. A one-time snapshot is perfectly sufficient.
5. Combining Data within Tableau
In our last lesson on pandas, you learned how to use pd.merge() to join different tables. You can perform the exact same operations directly within Tableau's Data Source page. This is incredibly powerful, as it lets you combine related data without having to do all the prep work beforehand.
When you drag multiple tables onto the canvas, Tableau automatically creates a Relationship between them, represented by a line (often called a "noodle"). This is Tableau's modern, flexible way of telling the tables how they relate.
For more control, you can double-click a table in the logical view to open the Physical Layer. Here, you can define traditional Joins (Inner, Left, Right, Full), just like you did in pandas.
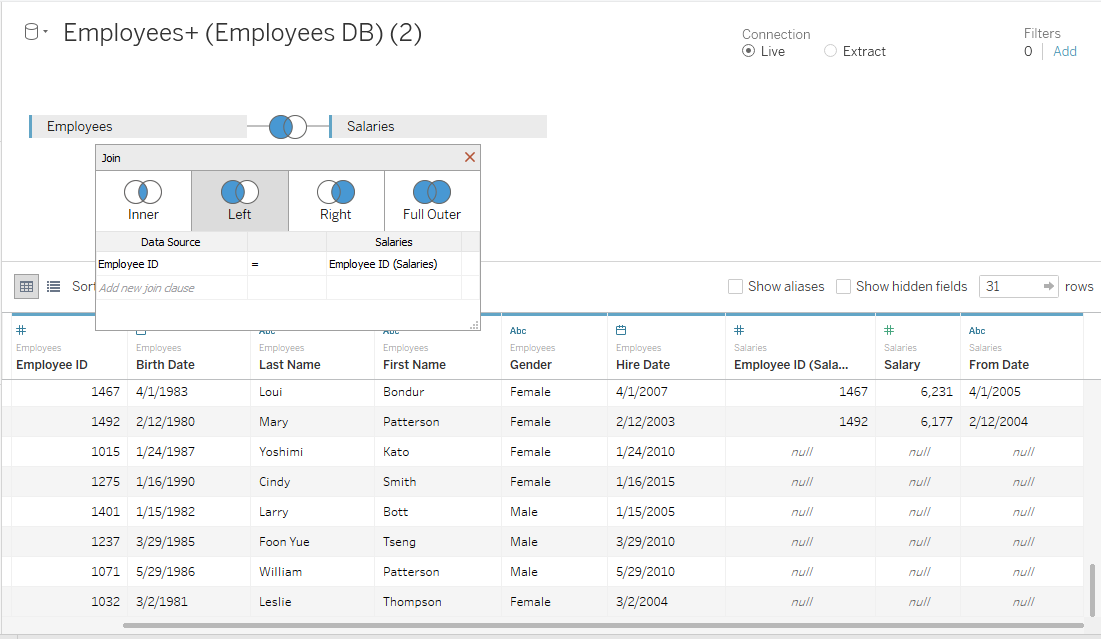
You don't need to master this today, but it's important to know that the data combination skills you learned in pandas are directly transferable to the Tableau environment.
Conclusion
Great work! You've successfully taken the first and most critical step in using Tableau: getting your data into the platform. You now understand how to connect to the most common types of business data sources and the important considerations that come with it.
Key Takeaways:
- Tableau can connect to a wide variety of sources, including files (Excel, CSV) and servers (SQL databases).
- The Data Source page is where you preview your data and verify its metadata (e.g., data types).
- You must choose between a Live Connection (real-time data, dependent on database speed) and an Extract (a fast, portable snapshot of data). For most analytical dashboards, extracts are the preferred choice.
- To share a self-contained workbook with others, save it as a Tableau Packaged Workbook (.twbx).
- You can combine multiple tables directly in Tableau using Relationships or traditional Joins.
Preview of the Next Lesson:
Now that you have connected to a data source and understand the fundamentals of importing data, you're ready for the fun part. In the next lesson, you will create fundamental visualizations like bar charts, line graphs, and scatter plots. You'll learn how to drag and drop your data fields to turn rows of data into insightful visuals that begin to tell a story.