Hello! Welcome back to our module on Data Visualization and Storytelling with Tableau.
In our last lesson, you mastered the essential first step of any analysis: connecting to data sources. You learned how to import data from files like Excel and CSV, connect to databases, and understood the critical difference between Live connections and Extracts.
Now that you have your data ready, it's time to transform it from rows and columns into meaningful insights. Today, we'll dive into the heart of Tableau and address this lesson's learning outcome: to create fundamental visualizations like bar charts, line graphs, and scatter plots. Mastering these three chart types is a cornerstone of business analysis. They are the primary tools you'll use to explore data, answer business questions, and begin telling a compelling story to your stakeholders.
1. The Tableau Workspace: Dimensions and Measures
Before we build our first chart, let's understand the building blocks within the Tableau worksheet. After connecting to your data and moving from the 'Data Source' tab to 'Sheet 1', you'll see your data fields organized on the left-hand side. Tableau automatically categorizes them into two main types, which are color-coded for clarity. Understanding this distinction is the single most important concept for building visualizations in Tableau.
The Best Visualization for You
This article from Tableau provides a clear and concise explanation of these fundamental concepts. Understanding them will make the drag-and-drop process intuitive.
Please read the section titled 'What are pills?'. It's near the end of the page. Focus on understanding the difference between: Dimensions vs. Measures: Dimensions (blue) are qualitative/categorical (e.g., Product Name, Country, Date). Measures (green) are quantitative/numeric (e.g., Sales, Clicks, Profit). Continuous vs. Discrete: Note how blue pills create distinct labels, while green pills create continuous axes.
In short:
- Dimensions slice your data. They create the headers and labels in your charts (e.g., the categories on a bar chart).
- Measures are the numbers you want to analyze. They are aggregated (e.g., SUM, AVG) and form the data points on your charts.
Your main workspace consists of Shelves (like 'Columns' and 'Rows') where you will drag and drop these "pills" to build your view.
2. The Bar Chart: Your Go-To for Comparisons
A bar chart is arguably the most common and effective chart type for a simple reason: it makes comparing values across different categories incredibly easy for the human eye.
When to use it: Use a bar chart when you want to compare a measure across several distinct categories.
- Business Question Example: "Which marketing channel drove the most website traffic last month?"
- Your AdTech Context: "Which ad creative has the highest click-through rate (CTR)?"
The following video provides an excellent, beginner-friendly walkthrough of creating a bar chart.
Learn Tableau in 15 minutes and create your first report (FREE Sample Files)
Watch this short clip to see how to build a bar chart from scratch. The presenter clearly explains the drag-and-drop process and the logic behind it.
Watch from 02:24 to 04:57. Pay close attention to how dragging the 'Country' dimension to 'Columns' and the 'Amount' measure to 'Rows' creates the chart. Also, notice the simple one-click sorting feature.
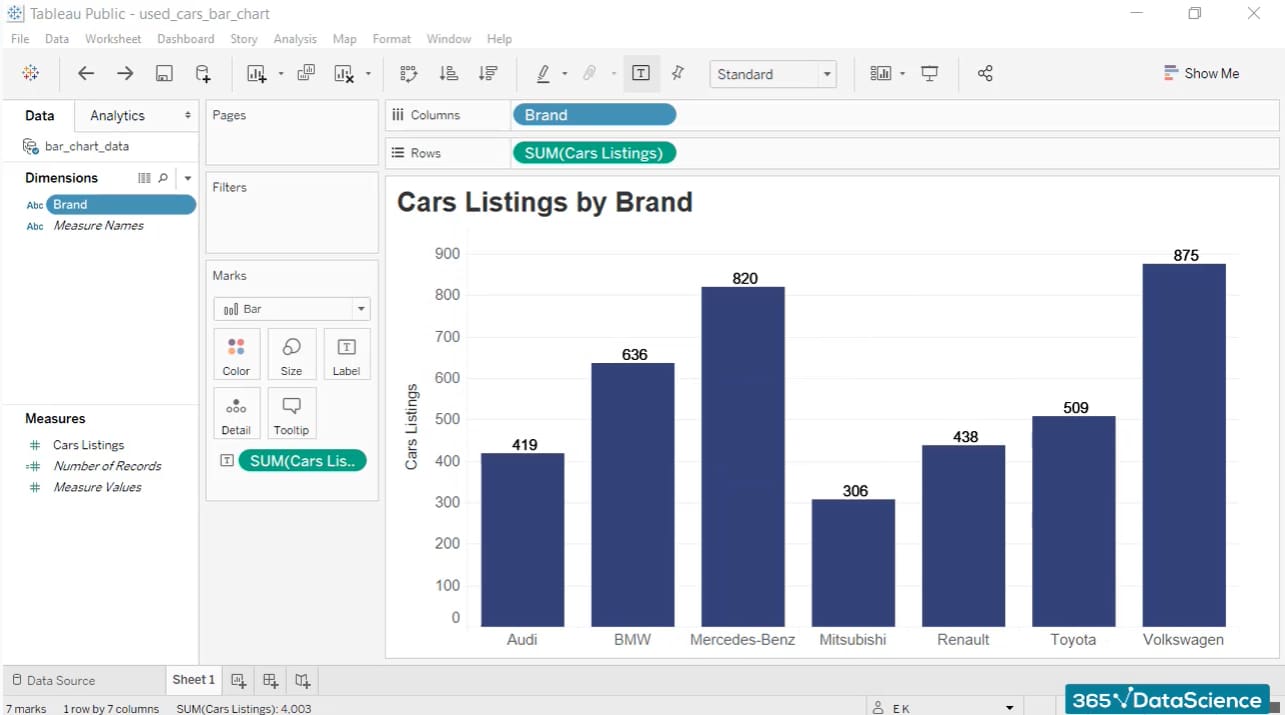
The process is straightforward:
- Drag a Dimension (e.g.,
Brand) to the Columns shelf. - Drag a Measure (e.g.,
SUM(Cars Listings)) to the Rows shelf.
Tableau will automatically create a bar chart, as the 'Show Me' panel recognizes this is the best practice for one dimension and one measure.
Test your understanding!
You are given a dataset with advertising campaign performance, containing the fields Campaign Name (Dimension), Ad Spend (Measure), and Conversions (Measure). You are asked to present which campaigns were the most expensive.
Which field would you drag to Columns and which to Rows to create a bar chart that answers this question?
Show answer
You would drag Campaign Name (Dimension) to Columns and SUM(Ad Spend) (Measure) to Rows. This would create a bar for each campaign, with the length of the bar representing its total ad spend, making it easy to compare costs.
3. The Line Chart: Revealing Trends Over Time
While bar charts are great for comparing static categories, line charts excel at showing the evolution of a measure over a continuous period, typically time.
When to use it: Use a line chart whenever you want to see trends, seasonality, or patterns in your data over time.
- Business Question Example: "How did our sales perform month-over-month last year?"
- Your AdTech Context: "What was the trend in daily ad impressions over the last 30 days?"
The basic construction is similar to a bar chart, but you use a date dimension.

Now, let's see how to build a similar chart. Area charts are a variation of line charts where the area below the line is shaded, often used to emphasize the volume or magnitude of change over time.
Charts In Tableau | Tableau Charts Tutorial | How To Create Charts In Tableau | Simplilearn
This video from Simplilearn demonstrates how to build an area chart, which follows the same principle as a line chart. It also shows a powerful technique: adding a dimension to the 'Color' mark to break down the trend into sub-categories.
Watch from 31:48 to 33:09. Observe the steps: Drag a Date Dimension (Order Date) to Columns. Drag a Measure (Quantity) to Rows. Notice how dragging a second Dimension (Region) onto the 'Color' mark splits the single line into multiple, color-coded lines, one for each region.
4. The Scatter Plot: Investigating Relationships
Bar and line charts analyze one measure at a time. But what if you want to see if two measures are related? That's where scatter plots come in.
When to use it: Use a scatter plot to determine the relationship between two numerical measures. Each mark on the chart represents a point where your dimension is plotted against both measures.
- Business Question Example: "Is there a relationship between a customer's discount rate and the quantity of items they purchase?"
- Your AdTech Context: "Does higher ad spend correlate with a higher number of conversions?"
Building a scatter plot involves using two measures.
- Drag your first Measure (e.g.,
SUM(IMDB Rating)) to the Columns shelf. - Drag your second Measure (e.g.,
SUM(Seasons)) to the Rows shelf.
Initially, you might just see a single point. This is because Tableau has aggregated both measures for all your data. To see the "scatter," you need to disaggregate the view by dragging a Dimension (e.g., Genre) onto the Detail mark on the Marks card.
Let's watch a demonstration.
Charts In Tableau | Tableau Charts Tutorial | How To Create Charts In Tableau | Simplilearn
This clip will show you how to create a scatter plot to visualize the relationship between two measures.
Watch from 30:27 to 31:48. Note that the video starts by creating a bar chart and then changes the mark type to 'Shape' to create a scatter plot. A more direct way is to put measures on both axes. The key takeaway is seeing two measures on Columns and Rows, and then using color to add another layer of detail.
When analyzing a scatter plot, you're looking for patterns:
- Positive Correlation: As one measure increases, the other tends to increase (points slope up and to the right).
- Negative Correlation: As one measure increases, the other tends to decrease (points slope down and to the right).
- No Correlation: The points are scattered randomly with no discernible pattern.
5. Guided Practice: Get Started with Tableau
Theory is great, but practice is better. Tableau provides an excellent official tutorial that walks you through creating your first visualizations using the popular 'Sample - Superstore' dataset. This is a perfect opportunity to apply what you've just learned in a structured way.
Tutorial: Get Started with Tableau Desktop
Now, let's put your knowledge into practice. Follow this official Tableau tutorial. It's built around a realistic business scenario and will guide you through creating your first views.
From the tutorial's main page, click the 'GO TO STEP' link for Step 2: Drag and drop to take a first look. Follow the instructions on that page to create a bar chart. Then, proceed to Step 3: Focus your results, where you will create a line chart. This will solidify your understanding of the core mechanics.
This hands-on exercise is invaluable. It will reinforce your understanding of dimensions, measures, and how to construct the fundamental chart types to answer real business questions.
Conclusion
Excellent work today! You've moved beyond simply connecting to data and have started the real work of a Business Analyst: visualization and exploration. By learning to create and interpret these three fundamental charts, you've built a solid foundation for all future data analysis in Tableau.
Key Takeaways:
- Tableau visualizations are built by placing Dimensions (blue pills) and Measures (green pills) on shelves.
- Bar Charts are for comparing a measure across categories. (1 Dimension, 1 Measure)
- Line Charts are for analyzing trends in a measure over time. (1 Date Dimension, 1 Measure)
- Scatter Plots are for investigating the relationship between two measures. (1 Dimension on Detail, 2 Measures)
- The chart type you choose should always be driven by the business question you are trying to answer.
Preview of the Next Lesson:
Now that you can create individual charts, the next step is to combine them into a cohesive and interactive report. In our next lesson, you will learn how to design and build an interactive dashboard with filters and actions. This is where you'll learn to empower your stakeholders to explore the data for themselves, taking your analysis from static images to a dynamic, decision-making tool.