Hello! Welcome to your next lesson in our journey through data analysis with pandas.
In our previous lesson, we focused on enriching our data at the individual row level by adding and modifying columns. You learned how to create new metrics like Click-Through Rate (CTR) and transform existing data for consistency. These are vital skills for preparing a dataset for analysis.
However, a Business Analyst's work rarely stops at the individual data point. Your stakeholders will ask questions like, "Which marketing channels are most effective?" or "What are our top-selling product categories by region?". To answer these, you need to move from looking at individual rows to seeing the bigger picture. This requires summarizing and aggregating data.
Today, you will learn how to perform data aggregation and summarization using groupby operations. This is one of the most powerful and frequently used features in pandas. Mastering groupby is non-negotiable for any data or business analyst role, and it's a skill you will almost certainly be tested on in technical interviews.
1. The Core Concept: Split-Apply-Combine
At its heart, a groupby operation is a three-step process. This framework, known as "Split-Apply-Combine," is the key to understanding how it works.
- Split: The data is split into groups based on some criteria (e.g., all rows for 'New York', all rows for 'Paris').
- Apply: A function is applied to each group independently (e.g., calculate the average temperature for each city's group).
- Combine: The results of the function applications are combined into a new data structure.
This next video provides an excellent conceptual and visual overview of this process.
Python Pandas Tutorial 7. Group By (Split Apply Combine)
Watch this clip from the codebasics channel. It clearly explains the Split-Apply-Combine strategy using a simple weather dataset.
Watch from the beginning to 02:52, and then from 06:18 to 07:55. Focus on understanding the three conceptual steps: splitting the data into city-based groups, applying a function like max(), and combining the results into a summary table.
To reinforce this, the following article provides a textual explanation of the same concept. It also shows how you can "peek inside" a groupby object to see the groups it has created.
pandas GroupBy: Your Guide to Grouping Data in Python
This article, 'pandas GroupBy: Your Guide to Grouping Data in Python' from Real Python, offers a great textual breakdown of the process. Reading this will solidify the concept from the video.
Read the section titled 'How pandas GroupBy Works'. Pay attention to the explanation of the 'split-apply-combine' chain and the code example that iterates over the groupby object to print each group. This is a useful debugging technique.
2. Performing groupby Aggregations
Now that you understand the concept, let's see how it's done in code. We'll start with the most common aggregation functions.
The video below, from Alex The Analyst, will walk you through the fundamental syntax. It uses a simple, intuitive dataset about ice cream flavors, making the concepts easy to grasp.
Group By and Aggregate Functions in Pandas | Python Pandas Tutorials
This video is a very practical guide that covers the essential groupby operations you'll use daily. We'll watch it in segments.
First, watch from the beginning to 02:39. This section shows how to: Load the data. Create a groupby object using df.groupby('column_name'). Apply a basic aggregation function, .mean(), to the object.
As you saw, the basic syntax is df.groupby('grouping_column').aggregation_function(). The column you group by becomes the new index of the resulting summary DataFrame.
Common Aggregation Functions
You can chain several common aggregation functions directly after a groupby() call. Let's explore a few more.
Group By and Aggregate Functions in Pandas | Python Pandas Tutorials
Let's continue with the same video to see other common aggregation functions in action.
Now watch from 03:02 to 05:59. This part covers: .count(): To get the number of items in each group. .min() and .max(): To find the minimum and maximum values. .sum(): To calculate the total for each group.
Notice the difference in how these functions treat non-numeric data. .mean() and .sum() ignore string columns, while .min() and .max() can operate on them alphabetically. .count() will count any non-missing value, regardless of its data type.
3. Advanced and Multi-Column Grouping
Real-world analysis often requires more nuance. You might need to group by more than one category or apply different aggregations to different columns.
Grouping by Multiple Columns
To get more granular insights, you can group by a list of columns. This creates a MultiIndex in the resulting DataFrame. For example, in an AdTech context, you might group by ['campaign_id', 'ad_set_id'] to see performance for each ad set within a campaign.
This next clip demonstrates this process.
Group By and Aggregate Functions in Pandas | Python Pandas Tutorials
Let's see how to group by more than one column to create more detailed summaries.
Watch from 07:48 to 09:40. The key is to pass a list of column names into the groupby method, like df.groupby(['base flavor', 'liked']).
The Power of .agg()
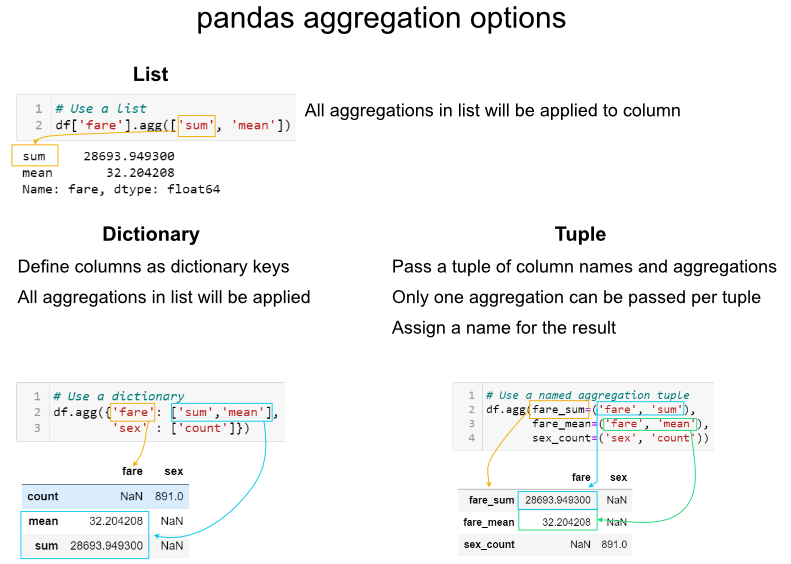
Chaining single functions like .mean() is great, but what if you want to calculate the sum of one column and the count of another? This is where the .agg() method comes in. It provides maximum flexibility for defining your aggregations.
The .agg() method typically takes a dictionary where:
- Keys are the column names you want to aggregate.
- Values are the aggregation function(s) you want to apply to that column.
Group By and Aggregate Functions in Pandas | Python Pandas Tutorials
The .agg() method is your go-to tool for complex aggregations. This part of the video explains it beautifully.
Watch from 05:59 to 07:48. Focus on the dictionary syntax used inside .agg(). See how it allows you to apply a list of different functions (['mean', 'max', 'count', 'sum']) to specific columns ('flavor_rating', 'texture_rating').
The image below summarizes the different ways you can use .agg() for powerful and customized aggregations.
Test your understanding!
You have a DataFrame ad_data with columns ['campaign_name', 'clicks', 'spend', 'conversions'].
Write the pandas code to find the following for each campaign:
- The total
spend. - The average number of
clicks. - The total number of
conversions.
Show answer
You would use groupby() on 'campaign_name' and then use .agg() with a dictionary to specify the different aggregations for each column.
import pandas as pd

# Sample data
data = {'campaign_name': ['Campaign A', 'Campaign B', 'Campaign A', 'Campaign B'],
        'clicks': [100, 150, 120, 180],
        'spend': [50, 70, 60, 90],
        'conversions': [5, 8, 7, 12]}
ad_data = pd.DataFrame(data)

# Group and aggregate
summary = ad_data.groupby('campaign_name').agg({
    'spend': 'sum',
    'clicks': 'mean',
    'conversions': 'sum'
})

print(summary)
This gives you a clean summary table answering all three questions at once.
4. Application: Answering Business Questions
Now let's put it all together in a realistic scenario. A key part of your role as a BA is to take a dataset and use it to answer concrete business questions. The groupby function is your primary tool for this.
The following article walks through a mock sales analysis project. Notice how almost every business question is answered with a groupby operation. This perfectly mirrors the type of work you will do as a BA.
Solving Real-World Business Questions with Python Pandas
This article demonstrates how to use pandas, particularly groupby, to solve real-world business problems with a sales dataset. This is a great example of applying the techniques you've just learned.
Read the article sections that answer 'Question 1: What was the best month for sales?' and 'Question 2: Which city had the highest number of sales?'. Notice the workflow: First, they perform feature engineering (like you learned in the last lesson) to create the 'Month' and 'Sales' columns. Then, they use df.groupby(...).sum() to aggregate the data and answer the question.
This example shows the direct link between a business need and the technical execution in pandas. When a stakeholder asks, "Which city is our biggest market?", you should immediately think, "I need to group by city and sum the sales."
Conclusion
Congratulations! You've just learned one of the most fundamental and powerful skills in data analysis. The ability to aggregate and summarize data is what separates data reporting from true analysis.
Key Takeaways:
- Data aggregation follows the Split-Apply-Combine model: splitting data into groups, applying a calculation to each, and combining the results.
- Use
df.groupby('column')to create groups. The grouping column becomes the index of the result. - You can apply simple aggregations like
.sum(),.mean(),.count(),.max(), and.min()directly after grouping. - For more control, use the
.agg()method with a dictionary to apply specific functions to specific columns. - You can group by multiple columns by passing a list of column names to
groupby()for more granular summaries.
Preview of the Next Lesson:
So far, all our analysis has been on a single, clean table. In the real world, data is often spread across multiple tables or files. For example, you might have one file with customer information and another with their order history. In our next lesson, you will learn how to merge and join multiple DataFrames to combine datasets, enabling you to perform a complete analysis using data from different sources.