Hello! Welcome to your next lesson in the "Advanced SQL for Business Analytics" module.
In our last lesson, we explored the power of window functions like ROW_NUMBER() and RANK() for segmenting and ranking data. You learned how to use PARTITION BY to create logical windows and the powerful pattern of combining window functions with Common Table Expressions (CTEs) to answer questions like, "Who are the top performers in each category?"
Today, we'll apply these advanced SQL skills to a core responsibility of any business analyst: defining and calculating Key Performance Indicators (KPIs). A KPI is a measurable value that shows how effectively a business is achieving its key objectives. Your work as a manager in AdTech and media planning has certainly involved tracking performance; now, you'll learn the formal process of translating those business metrics into robust SQL queries.
By the end of this lesson, you will be able to define and calculate KPIs relevant to business objectives using SQL, moving from a business question to a precise, data-driven answer.
From Metric to KPI: What's the Difference?
First, let's clarify the terminology. A metric is a quantifiable measure. Clicks, impressions, and spend are all metrics. A KPI, however, is a metric that is specifically chosen to measure progress toward a strategic business goal.
- Metric: We got 10,000 clicks.
- KPI: Our Click-Through Rate (CTR) was 2%, measuring the effectiveness of our ad creative at generating user interest.
- KPI: Our Cost Per Acquisition (CPA) was $50, against a target of $45, measuring the efficiency of our budget in acquiring new customers.
Given your background in AdTech, many of these KPIs will be familiar. The images below provide a great summary of common advertising performance indicators, their purpose, and their formulas. Think of these formulas as the business logic you will translate into SQL.
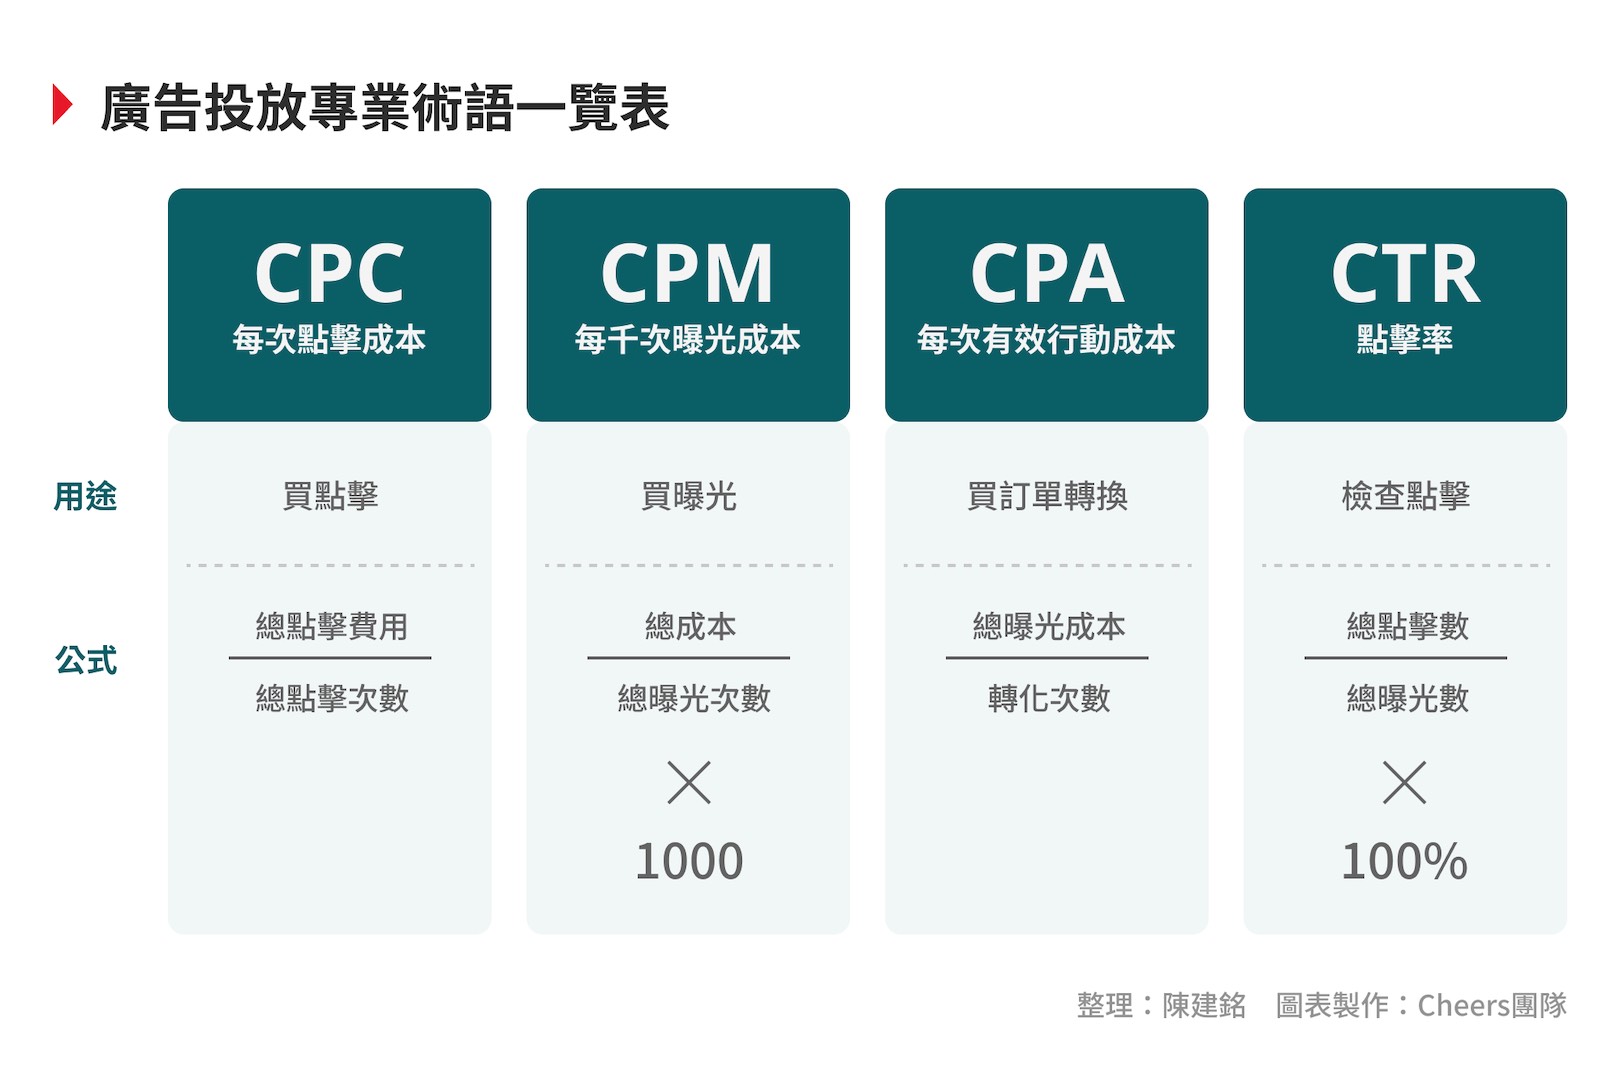
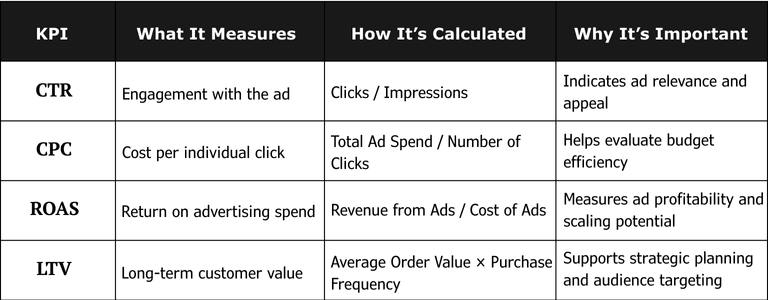
Calculating Foundational KPIs with SQL
Many KPIs can be calculated using the aggregate functions we've already covered (SUM, AVG, COUNT) combined with GROUP BY. The process is:
- Identify the business question: "Which campaign generated the most clicks and conversions?"
- Translate to metrics: We need
SUM(Clicks)andSUM(Conversions). - Identify the dimension: We need to see this "per campaign," so we'll
GROUP BY Campaign.
The following article provides a practical walkthrough of this process for a fictional marketing dataset.
Marketing Campaign Performance Analysis using SQL
This article, 'Marketing Campaign Performance Analysis using SQL', demonstrates how to answer key business questions by calculating basic KPIs.
Read the section '4. Analyze and Share'. Focus on the first two questions under 'Campaign Performance'. Notice how simple aggregate functions like SUM() and AVG() combined with GROUP BY are used to calculate total impressions, clicks, conversions, and average CPC for each campaign.
As you saw in the article, a query to assess campaign performance might look like this:
SELECT
  Campaign,
  SUM(impressions) AS Total_impressions,
  SUM(Clicks) AS Total_clicks,
  SUM(Conversions) AS Total_conversions,
  AVG(Daily_Average_CPC) AS avg_CPC
FROM Marketing
GROUP BY Campaign
ORDER BY Total_conversions DESC;
This query directly translates the business need for a campaign-level performance summary into SQL.
Calculating Complex KPIs with Joins and CTEs
While basic aggregations are useful, many crucial KPIs require combining data from multiple tables or involve multi-step calculations. This is where your knowledge of JOINs and CTEs becomes essential. A prime example from your AdTech world is Return on Ad Spend (ROAS).
To calculate true ROAS, you often need to:
- Aggregate ad spend from your advertising platforms (e.g., Google Ads, Facebook Ads).
- Aggregate sales revenue from your transactional system (e.g., Shopify, internal database).
- Join these two datasets on a common key (like a campaign name or UTM tag).
- Calculate the final KPI:
Revenue / Spend.
5 Advanced SQL Queries Every Marketer Should Master
Let's study a practical example of calculating a more complex KPI. This article demonstrates how to calculate a 'True ROAS' by combining data from different sources.
Read 'Query 2: True ROAS by campaign'. Pay close attention to the logic: a CTE campaign_spend is created to aggregate spend, another CTE sales_revenue is created to aggregate revenue, and then they are joined together to calculate true_roas. This is a classic and powerful pattern.
The ROAS example shows how CTEs help break down a complex problem into logical, manageable steps, making your queries more readable and easier to debug—a critical skill for a BA.
Using Window Functions to Calculate Performance Ranks
Now, let's tie this back to our previous lesson. KPIs are often used for ranking and identifying top performers. Business stakeholders don't just want to know the CPA of every campaign; they want to know the top 3 campaigns with the lowest CPA. This is a perfect use case for window functions.
The following video walks through several SQL interview problems for a Business Analyst role. We'll focus on one that is highly relevant to your background and demonstrates how to use window functions to identify top performers based on a calculated KPI.
3 SQL Queries Asked in Interview for Business Analyst - Solved
This video from techTFQ solves several BA interview questions. We'll focus on the second problem, which is set in an advertising context and requires identifying top-performing customers.
Watch the 'Advertising system deviations report' problem from 09:43 to 22:15. Notice the analytical process: Joining Tables: First, data from customers, campaigns, and events is joined to create a unified view. Aggregation: The data is grouped by customer and campaign status (success or failure) to COUNT the number of events (the metric). Ranking with a Window Function: The RANK() function is used with PARTITION BY status to find the #1 customer for successful campaigns and the #1 customer for failed campaigns. Filtering in the Outer Query: The entire logic is wrapped in a CTE, and the final query selects only the rows WHERE rnk = 1.
This example perfectly illustrates the end-to-end process: understanding the business request, joining and preparing the data, calculating a core metric (COUNT of events), and then using advanced SQL to rank and filter to produce the final, actionable insight.
Test your understanding!
You are given a table ad_spend with columns campaign_name, spend, and conversions.
Part 1: The business wants to measure the efficiency of each campaign. A key KPI for this is Cost Per Acquisition (CPA), calculated as Total Spend / Total Conversions. Write a SQL query to calculate the CPA for each campaign.
Part 2: Now, your manager wants to identify the top 3 most efficient campaigns (i.e., those with the lowest CPA). How would you modify your query using a CTE and a window function to get this result?
Show answer
Part 1: Calculate CPA for each campaign
This query uses basic aggregation to get the total spend and conversions for each campaign, then calculates the CPA.
SELECT
  campaign_name,
  SUM(spend) / SUM(conversions) AS cpa
FROM
  ad_spend
GROUP BY
  campaign_name;
Part 2: Find the top 3 most efficient campaigns
This requires the CTE + window function pattern. We first calculate the CPA in a CTE, then use DENSE_RANK() in a second CTE to rank them, and finally filter for the top 3 in the outer query. We use DENSE_RANK() so that if campaigns are tied for 3rd place, they are all included.
WITH campaign_cpa AS (
  SELECT
    campaign_name,
    SUM(spend) / SUM(conversions) AS cpa
  FROM
    ad_spend
  GROUP BY
    campaign_name
),
ranked_campaigns AS (
  SELECT
    campaign_name,
    cpa,
    DENSE_RANK() OVER (ORDER BY cpa ASC) AS cpa_rank -- ASC for lowest CPA
  FROM
    campaign_cpa
)
SELECT
  campaign_name,
  cpa
FROM
  ranked_campaigns
WHERE
  cpa_rank <= 3;
Conclusion
In this lesson, you've bridged the gap between business objectives and technical execution. You learned how to take a business concept—the KPI—and translate its definition into a SQL query. This is a fundamental skill that separates a data analyst from someone who just writes code. You are now equipped to answer not just "what happened?" but "how well are we doing?"
Key Takeaways:
- A KPI is a metric strategically chosen to measure progress towards a business goal.
- The process for calculating KPIs in SQL is to translate the KPI's formula and dimensions into a query.
- Simple KPIs can be calculated with aggregate functions and
GROUP BY. - Complex KPIs like ROAS often require
JOINs and CTEs to combine data from multiple sources. - Ranking KPIs to find top or bottom performers is a perfect use case for the window function patterns you learned in the previous lesson.
Preview of the Next Lesson:
Next, we will focus on a very specific but extremely common type of KPI analysis: "Calculate funnel metrics and conversion rates from raw event data." You'll learn how to track users as they move through a series of steps (like from viewing a product to adding to cart to purchasing) and calculate the conversion rates between each step. This is a critical analysis for any digital business and will build directly on the aggregation and sequencing skills you've developed.