Hello! Welcome to your next lesson in our "Advanced SQL for Business Analytics" module.
In our last session, we dove into defining and calculating Key Performance Indicators (KPIs), translating business objectives into powerful SQL queries using aggregations, CTEs, and window functions. You learned how to measure and rank performance, a cornerstone of any analyst's toolkit.
Today, we'll apply and extend those skills to a very specific, but incredibly common and valuable, type of analysis: funnel analysis. You'll learn how to take raw event data—the digital footprints users leave behind—and use it to calculate funnel metrics and conversion rates. This is a critical skill for understanding user behavior, optimizing products, and driving business growth. For someone with your background in AdTech, this directly relates to tracking a customer's journey from an ad impression all the way to a final conversion.
By the end of this 60-minute lesson, you will be able to calculate funnel metrics and conversion rates from raw event data using SQL.
What is a Funnel Analysis?
A funnel analysis tracks how users progress through a defined sequence of steps toward a desired outcome. It gets its name from the shape of the visualization, which narrows as users drop off at each stage.
Imagine an e-commerce website. Thousands of people might visit the landing page, but only a fraction will add a product to their cart, and a smaller fraction still will complete the purchase. This journey is a funnel.
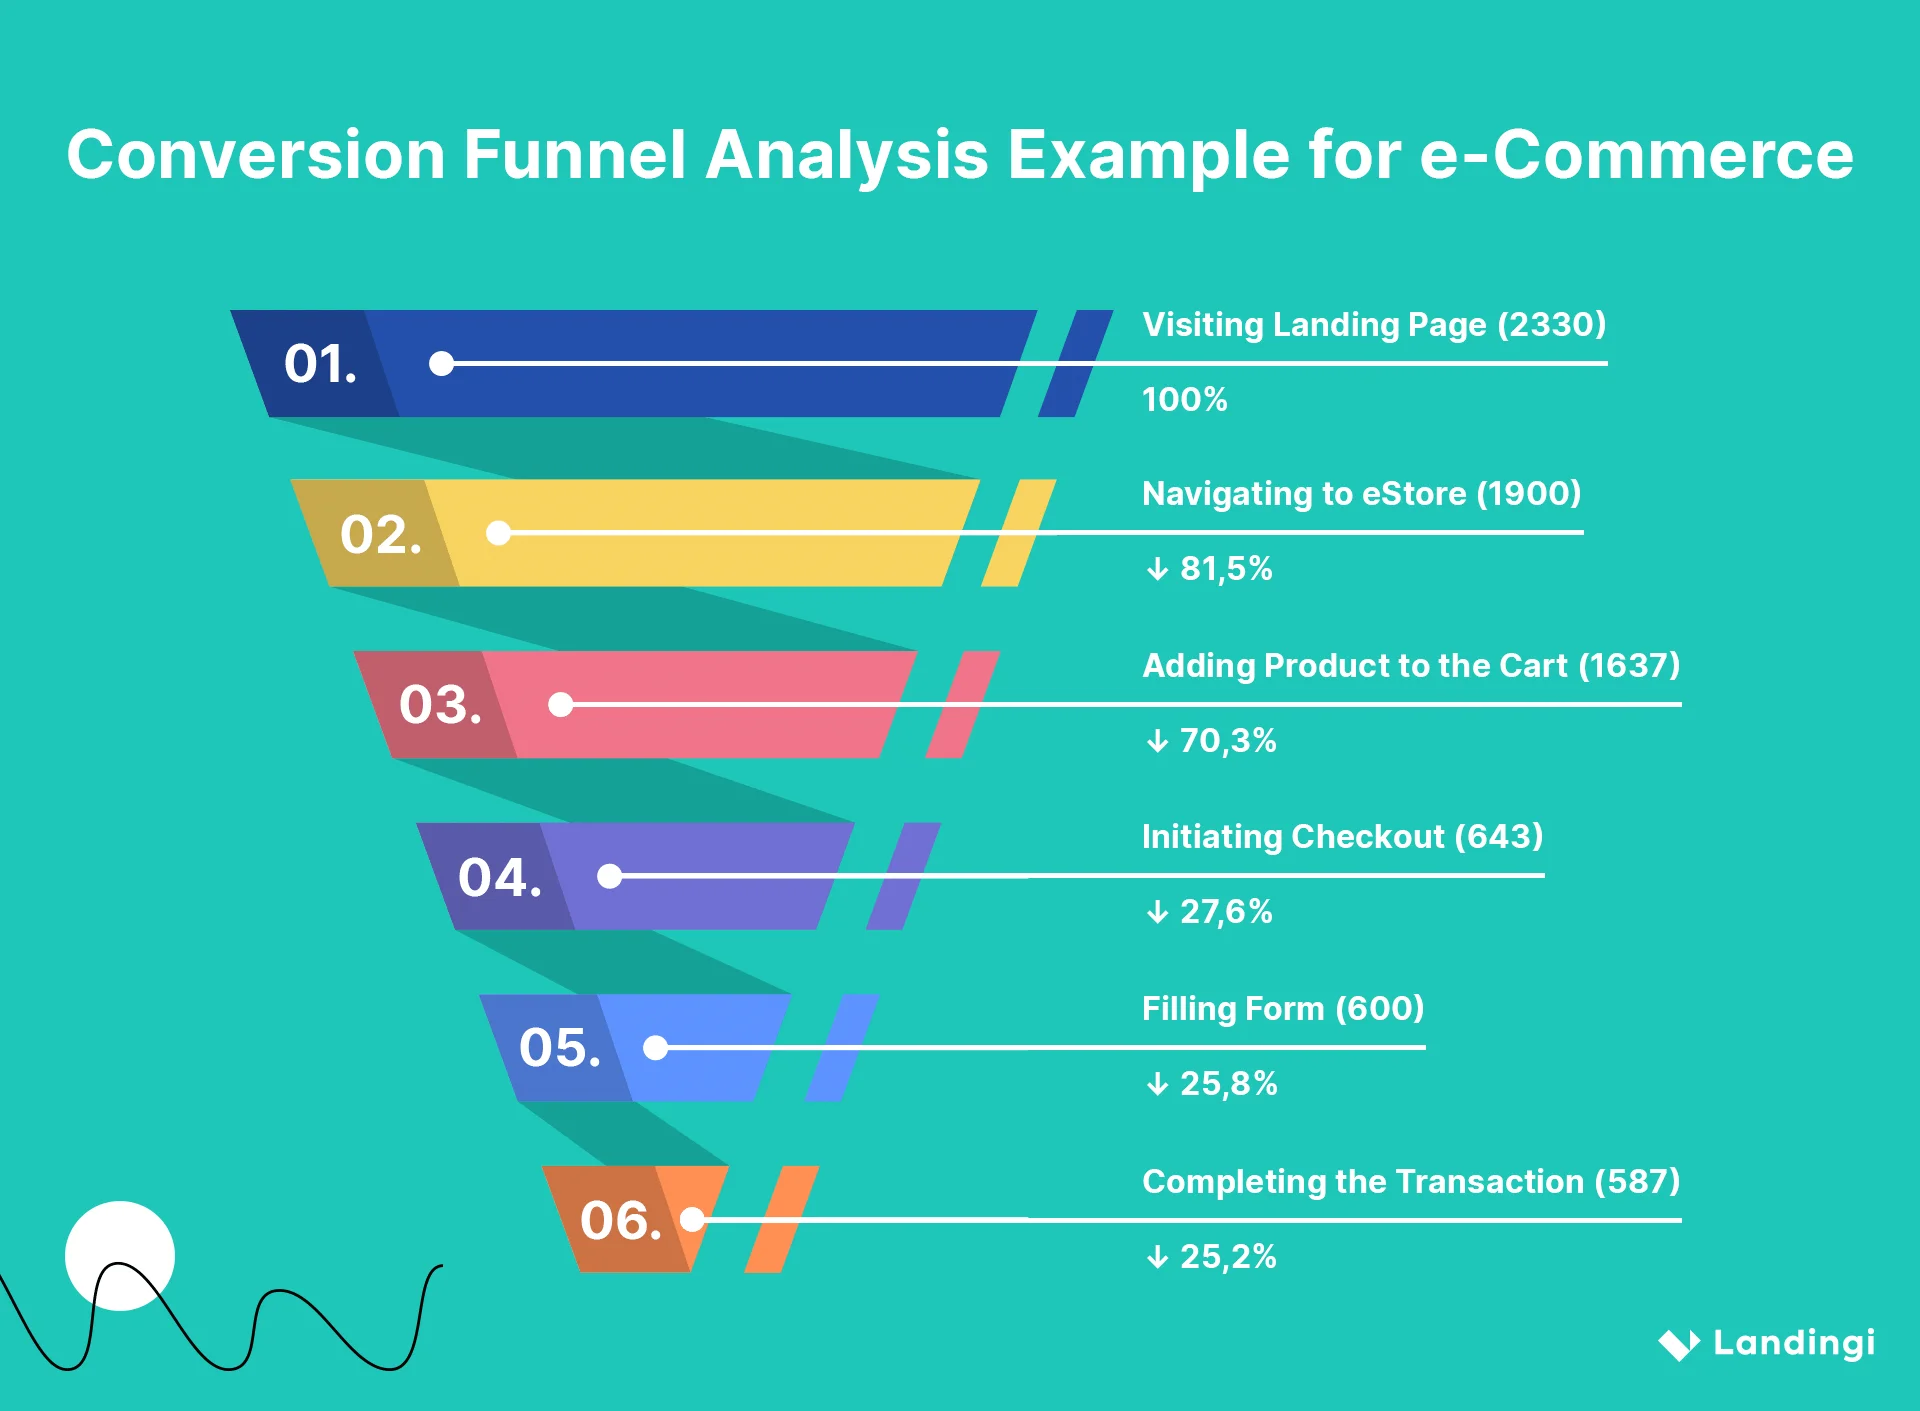
As a Business Analyst, you'll use funnel analysis to answer critical questions like:
- "Where in our signup process are we losing the most users?"
- "What is the conversion rate from 'free trial' to 'paid subscription'?"
- "Did our recent app update improve the user's path to purchasing?"
To understand the value of this skill in the job market, let's hear briefly about why it's considered a key project for any data analyst's portfolio.
The ONLY 3 Data Analyst Projects You Need to GET HIRED | Portfolio Series #1
This video from Jess Ramos's channel highlights three essential data analyst projects. We'll watch the segment on funnel analysis to understand its business importance.
Watch from 03:56 to 05:25. Pay attention to how a funnel analysis is described as a way to track user behavior, identify 'fallout' points, and translate a business problem into code. This perfectly frames the work we're about to do.
The Anatomy of a Funnel: Key Concepts
Before writing any SQL, it's crucial to define the components of your funnel. A poorly defined funnel leads to misleading metrics.
To learn about these core concepts, we'll turn to a guide on the topic.
Funnel Analysis 101: From Signup to Activation (and Beyond)
The article 'Funnel Analysis 101' provides clear definitions for the building blocks of a funnel analysis.
Read the first three sections: 'What is funnel analysis', 'Step design', and 'Attribution choices'. Focus on understanding these four key components: Step Definition: What are the specific events that make up your funnel (e.g., account_created, profile_completed)? Time Windows: How long do users have to complete the funnel? (e.g., 7 days from signup). Step Ordering: Do the steps have to be completed in a strict sequence? Attribution Logic: If a user repeats a step, which one counts? The article explains first-touch (first time they do it) vs. last-touch (most recent time). This is a critical concept in interviews.
Understanding these concepts is the "business analysis" part of the task. Your role isn't just to write the code, but to ask the right questions to ensure the analysis accurately reflects the business process.
A Standard SQL Pattern for Funnels
Now, let's get into the SQL. A common and straightforward way to calculate a funnel is to count the number of unique users who completed each step, regardless of order. This is often a great starting point for analysis.
The typical pattern uses COUNT(DISTINCT ...) with a CASE statement for each step of the funnel.
Let's look at a clear example of this pattern.
A Beginner's Guide to Sequence Analytics in SQL
The article 'A Beginner's Guide to Sequence Analytics in SQL' provides a simple, effective query for building a basic funnel.
Read the section titled 'Building a basic funnel'. The SQL query there demonstrates how to count distinct users for four different stages of a video-watching funnel. Notice the pattern: COUNT(DISTINCT CASE WHEN event_name = '...' THEN user_id END).
The general template looks like this:
SELECT
    -- Step 1: e.g., Visited Website
    COUNT(DISTINCT CASE WHEN event_name = 'visited_website' THEN user_id END) AS step_1_users,

    -- Step 2: e.g., Viewed Product
    COUNT(DISTINCT CASE WHEN event_name = 'viewed_product' THEN user_id END) AS step_2_users,

    -- Step 3: e.g., Added to Cart
    COUNT(DISTINCT CASE WHEN event_name = 'added_to_cart' THEN user_id END) AS step_3_users
FROM
    event_table;
From this output, you can easily calculate conversion rates. For example, the conversion rate from Step 2 to Step 3 would be (step_3_users / step_2_users) * 100. This pattern is simple, effective, and a great tool to have ready for analysis.
Case Study: Solving a Real-World Funnel Problem
The simple pattern is great, but real-world scenarios are often more complex, requiring specific attribution logic. Let's walk through a data science interview problem that requires calculating a notification conversion rate. This will bring together everything we've learned about CTEs, joins, and window functions.
We'll follow an expert as she solves this problem, from understanding the data to writing and refining the final query.
Meta SQL Data Scientist Interview: Calculate Notification Conversion Rates
This video from Jay Feng's channel features a data scientist solving a SQL problem from Meta. It's a perfect example of a practical funnel analysis task.
Watch the video from the beginning to 15:13. I've broken it down into stages to guide your focus: Understand the Problem & Data (00:00 - 02:19): First, see how she examines the available tables (notifications, notification_events, purchases) to understand what data she has to work with. Define Conversion & Attribution (02:19 - 04:20): This is the BA part! Listen to her define a 'conversion' and decide on an attribution model. She chooses last-click attribution: the purchase is attributed to the most recent notification the user clicked before buying. Build the Query (04:20 - 11:50): Watch her build the query step-by-step using CTEs and joins to implement the last-click logic. She first finds the last click time for each converting user, then joins back to find which notification that was. Refine with Window Functions (11:50 - 15:13): This is the advanced step. See how she refactors the query to use the FIRST_VALUE window function. This is a more efficient and elegant way to find the 'last click' and directly builds on what you learned in our previous lessons.
Let's recap the logic from that final, optimized query:
- Define the pool of potential conversions:
JOINclicks (notification_events) with purchases (purchases), keeping only clicks that occurred before the purchase. - Identify the converting click: Use the
FIRST_VALUE()window function, partitioned by user and ordered by the click timestamp in descending order. This efficiently finds thenotification_idof the last click before the purchase. - Count conversions per notification type: Aggregate the results from the previous step to get a
COUNTof conversions for each notification type. - Count total notifications sent: In a separate CTE, count the total number of notifications sent for each type from the
notificationstable. - Calculate the final rate: Join the conversion counts with the total counts and divide to get the conversion rate.
This case study is an excellent example of the thought process required for a Business Analyst role: define the business logic first, then translate it into an efficient and readable SQL query.
Test your understanding!
You are an analyst at a music streaming app. You have a table user_activity with columns: user_id, event_timestamp, and event_name (which can be 'app_open', 'search_song', 'play_song').
The product manager wants to know the conversion rate from searching for a song to playing a song.
Write a SQL query to calculate:
- The total number of unique users who searched.
- The total number of unique users who searched AND then played a song.
- The conversion rate (plays / searches).
Use the simple COUNT(DISTINCT CASE WHEN ...) pattern.
Show answer
Here is one way to solve it. We use CTEs to make the logic clear.
WITH funnel_steps AS (
  SELECT
    -- Count users who performed a search
    COUNT(DISTINCT CASE WHEN event_name = 'search_song' THEN user_id END) AS searchers,

    -- Count users who both searched and played a song
    -- We can identify them by checking if a user appears in both groups
    COUNT(DISTINCT
      CASE
        WHEN event_name = 'play_song'
        AND user_id IN (SELECT DISTINCT user_id FROM user_activity WHERE event_name = 'search_song')
      THEN user_id
      END
    ) AS players_who_searched
  FROM
    user_activity
)
SELECT
  searchers,
  players_who_searched,
  -- Calculate conversion rate, handling potential division by zero
  ROUND(100.0 * players_who_searched / NULLIF(searchers, 0), 2) AS conversion_rate_pct
FROM
  funnel_steps;
This query first counts the distinct users for the 'search' step. Then, for the 'play' step, it only counts users who are also present in the set of users who searched. Finally, it calculates the percentage.
Conclusion
In this lesson, you've learned how to perform one of the most fundamental types of product and business analysis: funnel analysis. You now have the conceptual framework and the SQL patterns needed to track user journeys and quantify conversion.
Key Takeaways:
- Funnel analysis is a method for measuring how users progress through a series of steps.
- Before writing code, you must clearly define your funnel's steps, time windows, and attribution logic (e.g., first-touch vs. last-touch).
- A simple funnel can be built using the
COUNT(DISTINCT CASE WHEN ...)pattern for each step. - More complex attribution logic, like "last-click," can be implemented with CTEs and aggregations, or more elegantly with window functions like
FIRST_VALUE, building directly on your advanced SQL skills.
Preview of the Next Lesson:
We've just analyzed a user's journey through a sequence of events in a relatively short timeframe. In our next lesson, we will zoom out to analyze user behavior over a much longer period. We will "Calculate cohort data using SQL for retention analysis," a technique that helps you understand user loyalty and the long-term value your product delivers.