Hello! Welcome back to our module on Business Process and System Modeling.
In our last few lessons, you've learned how to create 'as-is' process models using BPMN, including showing the sequence of tasks, decision points, and—most recently—who is responsible for each step using swimlanes. You now have the skills to document how a business process currently works. But a Business Analyst's job isn't just to be a scribe; it's to be an agent of improvement.
Today, we'll take that crucial next step. We will learn how to analyze an 'as-is' process model to identify inefficiencies and improvement opportunities. This is where you start creating real business value—by finding ways to save money, reduce errors, speed things up, and improve customer satisfaction. Mastering this skill is essential for your transition into a BA role and a very common topic in case study interviews.
This lesson will equip you with a structured framework for critiquing a process, teach you what to look for, and show you how to use both qualitative questions and quantitative data to back up your analysis.
What is 'As-Is' Process Analysis?
Before you can improve a process, you must deeply understand its current state. This is the core of 'as-is' analysis. It's about creating a baseline so you know where you're starting from.
The Basics of Documenting and Analyzing Your As-Is ...
The article 'The Basics of Documenting and Analyzing Your As-Is...' from Lucidchart provides a great overview of this concept. It explains what as-is analysis is and why it's the necessary first step before you can design a future 'to-be' process.
Please read the sections 'What is as-is process analysis?', 'Current state vs. future state process analysis,' and 'Benefits of analyzing your as-is process.' This will set the context for the rest of our lesson.
As the article highlights, without understanding the current state, any attempts to improve it are just guesswork. By mapping the 'as-is' process, you create a factual foundation for identifying problems and, eventually, designing a more efficient 'to-be' state.
A Framework for Analysis: What to Look For
Once you have your 'as-is' model (like the BPMN diagrams you've been learning to create), the analysis begins. Your goal is to spot problems. But "problems" can be a vague term. A more structured approach is to look for specific types of inefficiencies.
The Lucidchart article we just looked at introduces three key categories to hunt for.
The Basics of Documenting and Analyzing Your As-Is ...
Let's return to the Lucidchart article to learn a simple but powerful framework for your analysis.
Please read the section titled 'Identify gaps, bottlenecks, and weaknesses.' Focus on understanding the definition of each term.
So, as you examine a process map, you should be asking yourself:
- Where are the bottlenecks? A task or a person that slows everything down. Think of a single manager who must approve every small request, creating a long queue of work.
- Where are the gaps? Missing steps or information that cause errors later. For example, a customer service process that doesn't include a step to confirm the customer's shipping address, leading to delivery failures.
- Where are the weaknesses? Steps that are redundant, overly complex, or involve poor handoffs between teams. Think of two departments that have to manually re-enter the same data into different systems.
To help organize your thoughts during this analysis, BAs often use tools like a cause-and-effect diagram, also known as a Fishbone or Ishikawa diagram. It helps you brainstorm potential causes for a central problem (like "Process is Inefficient").
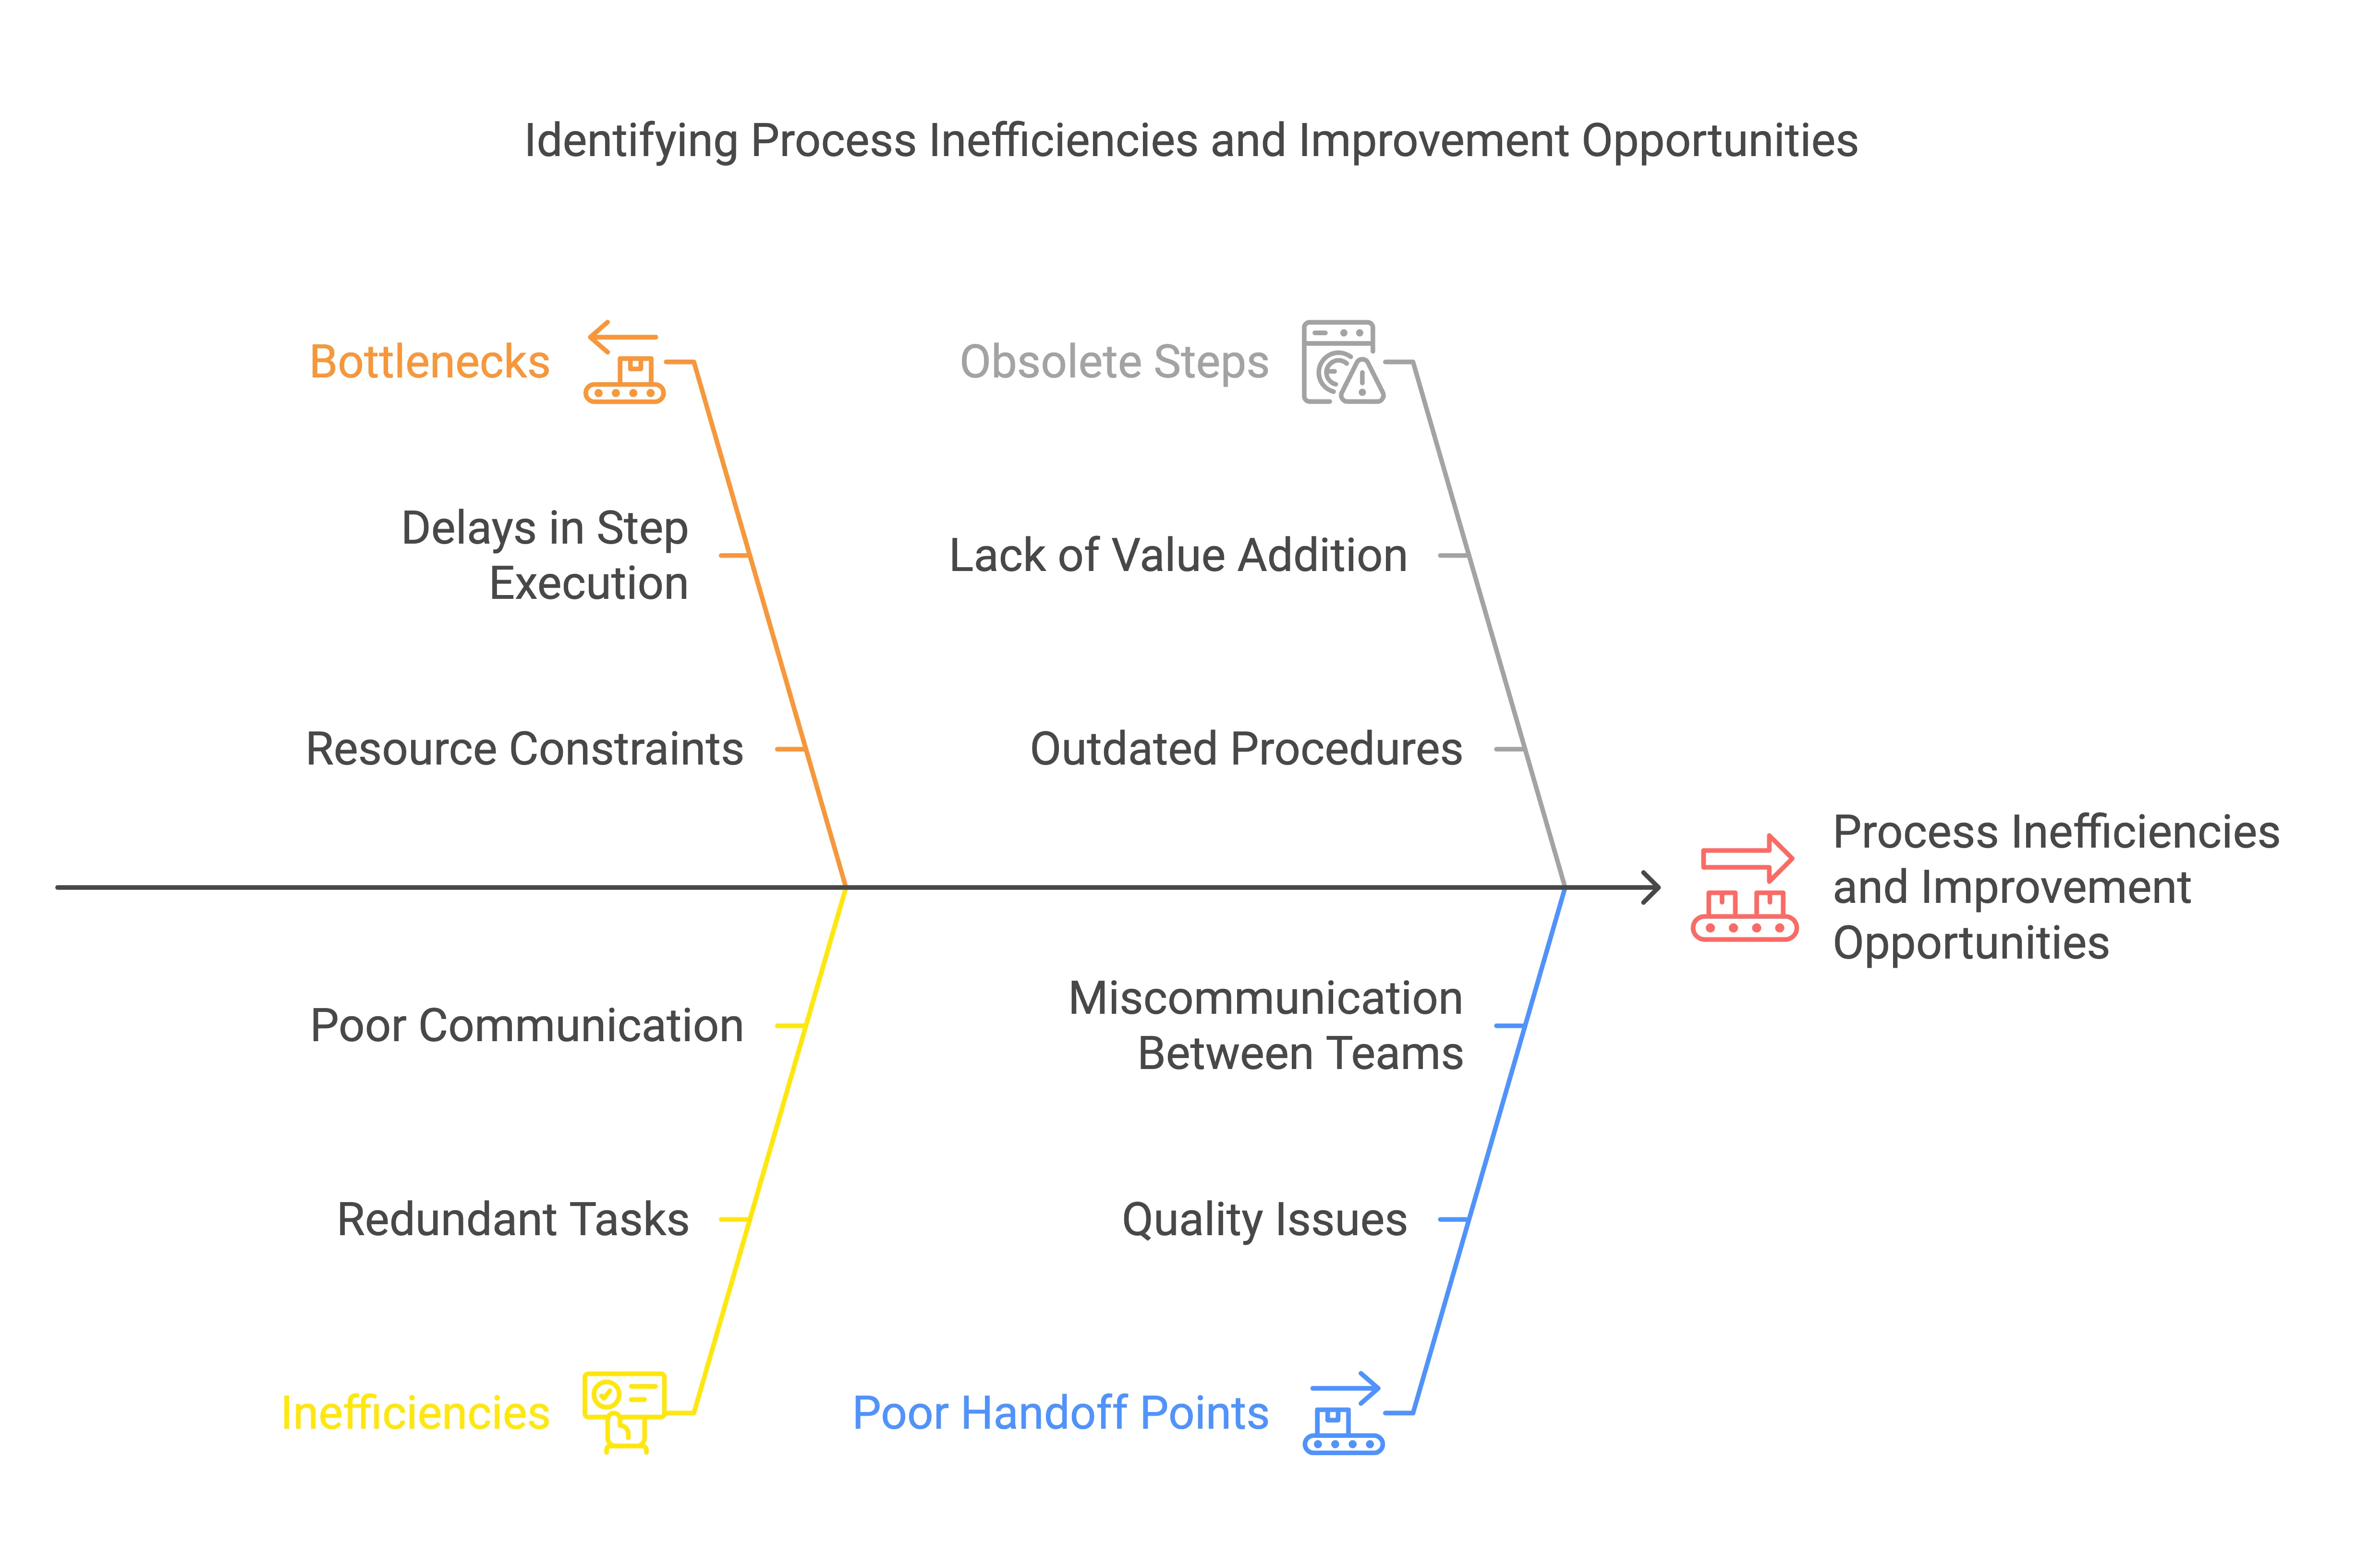
How to Find Inefficiencies: The Analyst's Toolkit
Knowing what to look for is the first step. Knowing how to find it is the practical skill. We'll cover two approaches: asking probing questions (qualitative analysis) and using data (quantitative analysis).
1. Qualitative Analysis: Asking the Right Questions
Your BPMN diagram is a visual guide for your investigation. By tracing the flow, you can identify areas that seem overly complicated or illogical.
Business Analysis Techniques - Process Analysis
The video 'Business Analysis Techniques - Process Analysis' by Yulia Kosarenko offers a set of excellent questions to ask when analyzing a process model.
Please watch from 05:31 to 08:25. The speaker discusses how real-world processes deviate from their theoretical design and provides a list of questions to help you identify areas for improvement.
As the video suggests, you should scrutinize your 'as-is' model with questions like:
- Are there steps that add no real value? (Obsolete Steps)
- Do we have too many handovers between different people or teams? (Weaknesses)
- Could steps currently done in sequence be performed in parallel to save time?
- Are there loops where work is constantly sent back for rework? Why?
- Are there bottlenecks where work piles up waiting for a specific person or resource?
Imagine you are presented with the marketing campaign process below. You could start asking questions like: "What happens if the customer comment is negative? Is there a process for that?" or "How long does the 'Analyze Results' step take? Could it be a bottleneck?"

2. Quantitative Analysis: The Goal-Question-Metric (GQM) Technique
While asking questions is powerful, the most convincing arguments are backed by data. An expert BA doesn't just say, "This process feels slow." They say, "This process takes an average of 5 days, while the industry benchmark is 2 days. This costs us X in lost productivity."
A fantastic technique for this is Goal-Question-Metric (GQM). It provides a simple, structured way to move from a high-level business goal to concrete, measurable data points.
Business Process Analysis Webinar
The 'Business Process Analysis Webinar' by ProTech provides a detailed walkthrough of the GQM technique. This is a core skill for any analyst wanting to make data-driven recommendations.
Please watch the video from 38:14 to 48:40. The speaker explains the GQM technique using a practical example of a Paid Time Off (PTO) request process. Pay close attention to how he moves from a goal, to questions, to specific data (metrics) needed to answer them.
Let's summarize the GQM flow from the video:
- Goal: Start with the business goal of the process. Why does this process exist? (e.g., "To ensure employees are paid correctly for their time off.")
- Question: Formulate questions that, if answered, will tell you if the process is meeting its goal. (e.g., "Are people taking time off without an approved request?")
- Metric: Identify the specific data you need to collect to answer your questions. These are your metrics. (e.g., "Number of unapproved absences per month," or "Correlation between work attendance logs and approved PTO requests.")
By collecting data on these metrics, you can objectively assess the health of the process.
Test your understanding!
Imagine you are analyzing a "Customer Order Fulfillment" process. One of the business goals is "To ensure customers receive their orders quickly."
Using the GQM framework, what is one question you could ask, and what is one metric you would measure to answer it?
Show answer
There are many possible answers, but here is a good example:
- Question: What is the total time from when a customer places an order to when they receive it?
- Metric: Average "Order-to-Delivery" time in hours/days.
Another example:
- Question: Where in the process are the biggest delays occurring?
- Metric: Average time spent in each process stage (e.g., 'Order Picking', 'Packaging', 'Shipping'). This would help you pinpoint bottlenecks.
Putting It All Together: An AdTech Example
Your background is in AdTech, so let's apply these concepts to a familiar scenario. The Interactive Advertising Bureau (IAB) provides best-practice guidelines for digital ad campaign workflows. We can use these as a benchmark to analyze a hypothetical 'as-is' process.
Scenario: You've been hired as a BA at an online publisher. The finance department is complaining about constant billing errors and delayed payments from ad agencies. Sales is complaining that campaigns are under-delivering. You suspect the "Campaign Delivery & Optimization" process is broken.
The IAB document outlines what an efficient process should look like. By comparing a broken 'as-is' process to these best practices, you can pinpoint inefficiencies.
Interactive Advertising Workflow Best Practices
The 'Interactive Advertising Workflow Best Practices' document from the IAB is a real-world guide for your industry. We will focus on the best practices for publishers during the campaign delivery stage.
Please read the section 'Publisher Best Practices' under the 'Campaign Delivery & Optimization Stage' (starts on page 18). As you read, imagine you are analyzing a company that does none of these things. For each best practice, think about what kind of inefficiency (bottleneck, gap, weakness) would exist if it were ignored.
Now, let's analyze.
Example Analysis:
- IAB Best Practice: "Post-launch testing should occur within one business day of initial launch... to confirm each tag has been implemented properly."
- 'As-Is' Inefficiency: Your company doesn't do this. Ad Operations only checks tags if an agency complains. This is a gap in the process.
- Impact: Incorrectly implemented tags lead to massive impression discrepancies between the publisher's numbers and the agency's numbers. This causes a bottleneck at the end of the month in the billing department, which now has to spend days manually reconciling the numbers, delaying payments.
- GQM Application:
- Goal: Ensure accurate and timely billing.
- Question: What percentage of our campaigns have a delivery discrepancy greater than 10% at the end of the month?
- Metric: The percentage of campaigns with >10% discrepancy. (The IAB T&Cs even define 10% as a material threshold!)
By following this analytical process, you can move from a vague complaint ("Billing is a mess") to a specific, data-backed problem statement ("The lack of a post-launch testing process is causing a 35% discrepancy rate, which delays invoice payments by an average of 15 days."). This is the kind of high-impact analysis that defines a successful Business Analyst.
Conclusion
Today, you've learned how to transform a static process diagram into a dynamic tool for analysis and improvement. You are no longer just a documenter of processes; you are a critic and an architect of better ones.
Key Takeaways:
- 'As-is' process analysis is the foundation for any process improvement initiative.
- Systematically search for bottlenecks, gaps, and weaknesses in the current process.
- Use probing qualitative questions to challenge every step in your process model.
- Apply the Goal-Question-Metric (GQM) framework to ground your analysis in hard data and measure process performance objectively.
- Comparing your current process to industry best practices is a powerful way to identify improvement opportunities.
Preview of the Next Lesson:
After analyzing a process and identifying an area for improvement (e.g., a manual task that should be automated), what's next? You need to define what the new or improved system should do. In our next lesson, you will learn how to create use case diagrams to represent system functionality and actors. This is a classic BA technique for translating a business need into functional system requirements, moving us one step closer to designing the 'to-be' solution.