Hello! Welcome back to our course on business analysis.
In our last lesson, we focused on analyzing 'as-is' process models to pinpoint inefficiencies like bottlenecks, gaps, and weaknesses. This is a critical skill for understanding what's wrong. Today, we take the next logical step: beginning to define what the solution should do.
This lesson will teach you how to create use case diagrams to represent system functionality and actors. This is a fundamental technique in a Business Analyst's toolkit. Use case diagrams are a powerful way to visually communicate the scope of a system and how users will interact with it, translating business needs into a high-level blueprint for the technical team. It’s an essential tool for stakeholder communication and a common requirement in BA job descriptions and interviews.
By the end of this lesson, you will be able to identify the key components of a use case diagram and build one for a given scenario.
What is a Use Case Diagram?
At its core, a use case diagram is a simple, high-level map that shows the interactions between a system and the people or other systems that use it. It's part of the Unified Modeling Language (UML), which is the industry standard for software and system modeling.
The primary goal is to show what a system does from an end-user's perspective, not how it does it. This makes it an excellent communication tool to align business stakeholders and developers on the system's intended functionality.
UML use case diagrams: Everything you need to know
To start, let's watch a brief introduction from the Lucid Software channel. This clip clearly explains the purpose of a use case diagram and why it's so helpful for translating an idea into a plan.
Please watch the first minute of the video (00:00 - 01:04) to get a high-level overview.
As the video explains, a use case diagram helps clarify how users would interact with a system and what its main functions would be, making it invaluable in the early stages of a project.
The Core Components of a Use Case Diagram
A use case diagram is built from a few simple, standardized shapes. Understanding these is the first step to creating your own.
We will build a simple banking app diagram step-by-step.
UML use case diagrams: Everything you need to know
The same Lucid Software video provides an excellent walkthrough of the fundamental building blocks. It introduces each component by constructing a simple diagram for a banking app.
Watch the segment from 01:21 to 06:16. Pay attention to the definition and visual representation of these four key elements: System Boundary (the box) Actors (the stick figures) Use Cases (the ovals) Association (the lines connecting them)
Let's quickly summarize those key building blocks:
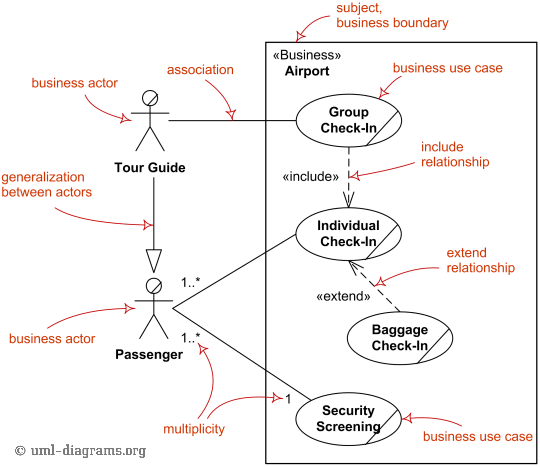
- System Boundary: A rectangle that defines the scope of the system. Everything inside the box is part of the system we are modeling; everything outside is not.
- Actors: These are the users or external systems that interact with our system.
- They are represented by stick figures (for humans) or boxes (for other systems).
- They are roles, not specific individuals (e.g., "Customer," not "Jane Doe").
- Primary Actors (usually on the left) initiate an action.
- Secondary Actors (usually on the right) react to an action or are involved in the process.
- Use Cases: These are the specific functionalities or goals an actor can achieve with the system.
- Represented by horizontal ovals.
- Named using a clear verb-noun format (e.g., "Check Balance," "Transfer Funds").
- Association: A solid line connecting an actor to a use case, indicating that the actor interacts with that function.
The image below provides a fantastic visual summary, labeling all the core components we've just discussed within the context of an airport system.
Showing Complex Interactions: Relationships
Real-world systems often have functionalities that are shared, optional, or variations of each other. Associations alone can't capture this richness. We use three special types of relationships to model these dependencies.
UML use case diagrams: Everything you need to know
Let's return to the Lucid Software video. It does a brilliant job of explaining the three key relationship types—Include, Extend, and Generalization—using clear examples and a memorable analogy.
Please watch from 06:16 to 11:14. Focus on understanding the difference between <<include>> and <<extend>>, especially the direction of the arrows and the conditions under which each is used.
Here is a breakdown of these crucial relationships:
-
<<include>>Relationship:- Purpose: To show that one use case's behavior is always part of another. Think of it as a mandatory, non-optional subroutine.
- Example: "Transfer Funds"
<<includes>>"Verify Sufficient Funds." You cannot complete the transfer without first checking the balance. - Notation: A dashed arrow from the base use case to the included (required) use case.
-
<<extend>>Relationship:- Purpose: To show optional functionality that only runs under certain conditions. It extends the behavior of the base use case.
- Example: "Log In" can be
<<extended>>by "Display Login Error." The error message only appears if the login fails; it's not part of every login attempt. - Notation: A dashed arrow from the extending (optional) use case to the base use case.
-
Generalization Relationship:
- Purpose: To show a parent-child relationship where a "child" use case is a more specialized version of a general "parent" use case.
- Example: "Make Payment" could be a general (parent) use case, with "Pay by Card" and "Pay by Bank Transfer" as its specialized children.
- Notation: A solid line with a hollow triangle arrowhead pointing from the child to the parent.
Test your understanding!
You are modeling an e-commerce checkout process. The main use case is "Place Order." For every order, the system must validate the customer's shipping address ("Validate Address"). If the customer is new, they are given an optional use case to "Apply New Customer Discount."
How would you model the relationships between "Place Order," "Validate Address," and "Apply New Customer Discount"?
Show answer
- The relationship between "Place Order" and "Validate Address" is an
<<include>>relationship. Address validation is mandatory for every order. The arrow would point from "Place Order" to "Validate Address." - The relationship between "Place Order" and "Apply New Customer Discount" is an
<<extend>>relationship. Applying the discount is optional and conditional. The arrow would point from "Apply New Customer Discount" to "Place Order."
From Theory to Practice: Building Your Own Diagram
Knowing the rules is one thing; applying them is another. How do you decide what the actors and use cases should be?
The article 'What is Use Case Diagram?' from Visual Paradigm offers a set of guiding questions to help you methodically identify actors and use cases during your requirements gathering.
Please read the sections 'How to Identify Actor' and 'How to Identify Use Cases'. These provide practical, question-based checklists that you can use in your projects.
AdTech Example: Campaign Management UI
Let's apply this to a scenario from your AdTech background. Imagine you are a BA tasked with defining the requirements for a new user interface for an ad server.
-
Identify Actors: Using the questions from the article...
- Who uses the system? An "Ad Ops Manager" to set up campaigns. A "Media Planner" (a role you've held!) to check delivery.
- What other systems use this system? A "Reporting System" might pull data via an API.
- Who provides information to the system? The Ad Ops Manager and Media Planner.
-
Identify Use Cases:
- What functions will the actor want? The Ad Ops Manager will want to "Create Campaign," "Upload Creatives," and "Set Targeting Rules." The Media Planner will want to "View Campaign Performance." The Reporting System will want to "Request Delivery Data."
- Does the system store information? Yes. "Create Campaign" implies storing campaign data.
-
Structure the Diagram:
- System Boundary: "Ad Server UI"
- Actors: Ad Ops Manager (primary), Media Planner (primary), Reporting System (secondary).
- Use Cases: Create Campaign, Upload Creatives, Set Targeting Rules, View Campaign Performance, Request Delivery Data.
- Relationships:
- "Create Campaign"
<<includes>>"Set Targeting Rules." You can't create a campaign without defining who to show it to. - "View Campaign Performance" might be
<<extended>>by an optional "Email Report" use case.
- "Create Campaign"
This structured process moves you from a blank page to a clear, functional overview that both your project manager and a developer can understand.
Here's an example of a use case diagram that models the activities of a Business Analyst—it shows how the techniques you're learning fit into your future role!

Conclusion
In this lesson, you've learned to bridge the gap between process analysis and system requirements by using use case diagrams. This is a crucial step in ensuring that the solutions you propose directly address the business needs you've identified.
Key Takeaways:
- A Use Case Diagram is a high-level visual model of a system's functionality from the user's perspective.
- The core components are the System Boundary, Actors (who interacts), and Use Cases (what they can do).
- Relationships like
<<include>>(mandatory),<<extend>>(optional), and Generalization (parent-child) allow you to model complex dependencies. - A structured approach, using guiding questions, helps you systematically identify the actors and use cases for any system.
Preview of the Next Lesson:
While a use case diagram shows what actors can do, it doesn't show the flow of information between the system and the outside world. In our next lesson, you will learn how to develop a Level 0 Data Flow Diagram (Context Diagram). This diagram provides a birds-eye view of a system's boundaries and the key data that flows into and out of it, complementing the functional view provided by use case diagrams.