Hello! Welcome back to our module on AI in Radiographic Diagnosis.
In our last lesson, we explored the sophisticated workflow an AI uses to detect caries, from pre-processing the image to the final classification by a Convolutional Neural Network (CNN). We answered the question, "How does the AI find a lesion?"
Today, we address the critical next step for you as a clinician: "What do I do with the AI's findings?" Our goal is to learn how to interpret AI-generated caries detection outputs, including confidence scores and visual overlays. This lesson will equip you to translate the AI's analysis into clinically meaningful information, moving from the technical process to practical application at the chairside.
From Detection to Display: How AI Communicates Findings
When an AI system analyzes a radiograph, it doesn't just give a "yes" or "no" answer. It provides rich, layered information designed to guide your eye and inform your judgment. This information is typically presented in two main forms:
- Visual Overlays: Graphics drawn on the radiograph to show where and what the AI has found.
- Confidence Scores: A numerical value representing how certain the AI is about its finding.
Let's break these down one by one.
1. Interpreting Visual Overlays
Visual overlays are the most immediate and intuitive part of an AI's output. They are annotations layered directly onto the radiograph.
Let's look at a clear example of this.

As you can see in the 'Result image' panels, the AI doesn't just point to a tooth. It provides specific, localized findings. These overlays can take several forms:
- Bounding Boxes: These are simple rectangular boxes drawn around a suspected area of interest. This is the most common form of overlay. The orange, red, and yellow boxes in the image above are examples.
- Segmentation Masks: These are more sophisticated overlays that precisely outline the exact shape of the detected feature. This can be very useful for assessing the size and extent of a lesion.
- Color Coding and Labels: As seen in the image, different colors (e.g., orange vs. red) or labels (e.g., D1, D2, D3) can be used to classify the finding. A system might use different colors to suggest the depth of a carious lesion (e.g., enamel-only vs. dentin involvement) or to distinguish between caries, restorations, and other features.
To see another style of visualization, let's turn to a white paper from the American Dental Association (ADA).
[PDF] Overview of Artificial and Augmented Intelligence Uses in Dentistry
This document, 'Overview of Artificial and Augmented Intelligence Uses in Dentistry,' includes figures that illustrate how commercial AI systems present their findings.
Please examine Figure 3 and Figure 4 on page 11. Notice how Figure 3 uses bounding boxes for caries and outlines for tooth segmentation. Figure 4 shows a segmentation mask, highlighting the enamel (red) and the carious lesion (yellow).
The key takeaway is that visual overlays are the AI's way of saying, "Look here." They immediately draw your attention to specific locations on the radiograph that the algorithm has flagged as warranting further investigation.
2. Understanding Confidence Scores
While overlays show you where to look, the confidence score tells you how important that finding might be. It's a numerical expression of the AI's certainty, typically from 0 to 1 (or 0% to 100%).
In the "Tooth Decay AI" image we just examined, you can see these scores next to the labels (e.g., D1 0.69, D2 0.82).
- A score of 0.82 means the model is 82% certain that the features in that bounding box correspond to a carious lesion it was trained to detect.
- A score of 0.69 indicates a lower, but still significant, level of confidence.
So, what is a "good" score?
This is a crucial clinical question, and the answer involves a concept called the detection threshold. Most AI software allows the user (or manufacturer) to set a threshold. The system will only display findings that have a confidence score above this threshold.
- Low Threshold: Setting a low threshold (e.g., >0.20) means the AI will show you almost everything it finds, even low-confidence findings. This increases sensitivity (you are less likely to miss a true lesion), but it also increases the number of false positives (the AI flags things that are not lesions).
- High Threshold: Setting a high threshold (e.g., >0.85) means the AI will only show you high-confidence findings. This increases specificity (the findings shown are very likely to be true lesions), but it risks missing more subtle or early-stage lesions (false negatives).
The following image provides a perfect illustration of this trade-off.
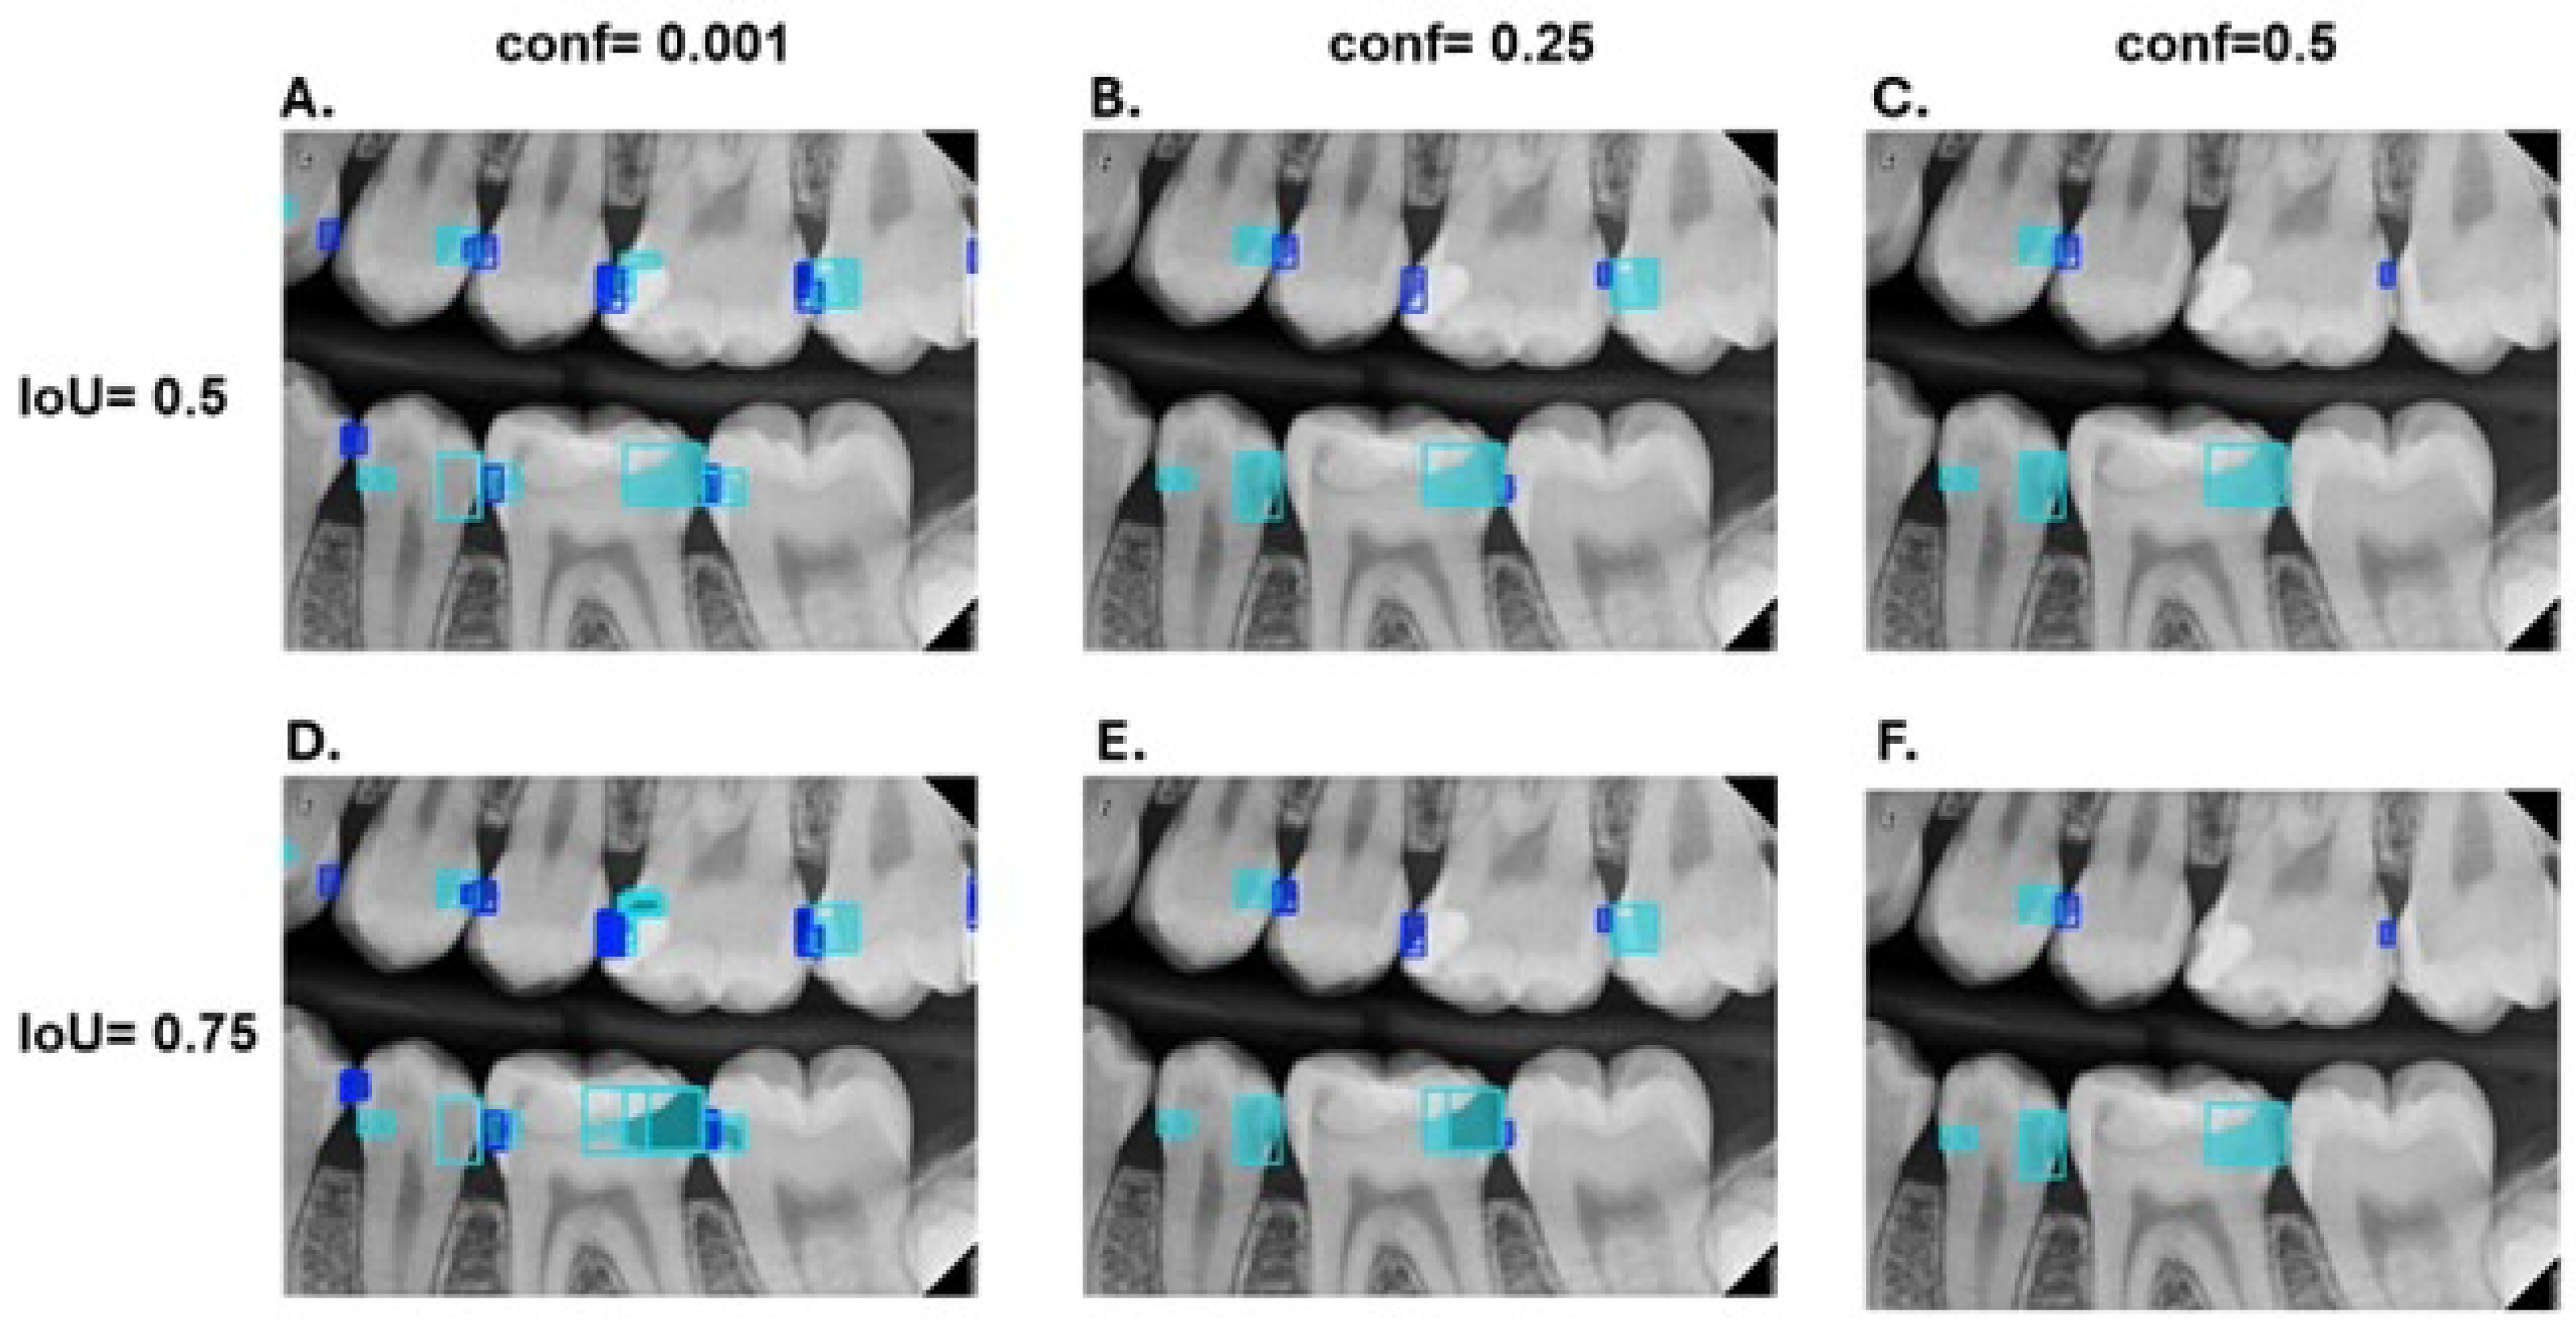
Look closely at the top row (A, B, C):
- In Panel A (conf=0.001), the threshold is extremely low. The AI is showing everything that has even a tiny chance of being a lesion, resulting in a cluttered image with many potential false positives.
- In Panel C (conf=0.5), the threshold is higher. The AI is now only displaying findings it is at least 50% sure about, leading to fewer, more reliable detections.
This trade-off is fundamental to using AI in diagnostics. For a deeper look at this, let's review a section of the ADA white paper that discusses system performance.
[PDF] Overview of Artificial and Augmented Intelligence Uses in Dentistry
Let's return to the ADA's 'Overview of Artificial and Augmented Intelligence' paper. The appendix contains an excellent discussion on system performance that directly relates to confidence scores and clinical use.
Please read the section 'System Performance' on page 32. Focus on how the intended use of the system (e.g., screening vs. treatment planning) influences whether you'd prioritize sensitivity or specificity, and thus how you might set the confidence threshold.
As the paper highlights, if you are using AI as a screening tool, you might prefer a lower threshold to ensure nothing is missed. If you are using it to confirm a diagnosis before an irreversible procedure, you might want a very high threshold to minimize false positives.
Synthesizing AI Output with Your Clinical Judgment
Now, let's put it all together. How do you integrate these overlays and scores into your daily workflow? The key is to view the AI not as a replacement for your expertise, but as a powerful assistant.
A leading company in this space, Pearl, has a blog post that frames this relationship well.
Dental Radiograph Analysis & Image Interpretation - Pearl AI
This article from Pearl AI, a major developer of dental AI, explains how their technology is designed to be used in practice.
Please read the section 'Understanding AI-powered radiograph analysis technology.' Pay close attention to the sentences that describe how AI outputs are generated and the statement that AI tools 'complement your clinical judgment rather than replace it.'
The ideal clinical workflow using AI looks something like this:
- Initial Review: You conduct your own, unaided interpretation of the radiographs first. This establishes your primary diagnosis without bias from the AI.
- Activate AI: You then turn on the AI overlays.
- Corroborate and Discover: You evaluate the AI's findings against your own:
- Confirmation: The AI flags a lesion you already identified. This increases your diagnostic confidence and is excellent for patient communication.
- Discovery: The AI flags a potential lesion you did not initially see. This is where AI provides immense value. Your job now is to critically re-evaluate that specific area. Zoom in, adjust contrast, and use your clinical knowledge. Is it a true lesion that you missed, or is it an AI false positive (e.g., a Mach band effect, a variation in anatomy)?
- Disagreement: You identify a lesion that the AI missed. This is a reminder that no system is perfect. Your clinical judgment is final.
The AI acts as a tireless second reader, ensuring you've systematically checked every surface and providing a quantitative measure of certainty to support your decisions.
Conclusion
In this lesson, we have demystified the outputs of a caries detection AI. You are now equipped to read the language of these systems, understanding what they are showing you and how confident they are in their findings.
Key Takeaways:
- Visual Overlays (bounding boxes, segmentation masks) use graphics and colors to show you where and what the AI has detected on a radiograph.
- Confidence Scores provide a numerical probability (0-100%) of the AI's certainty, helping you gauge the significance of a finding.
- The detection threshold is a critical setting that balances sensitivity (catching all true lesions) and specificity (avoiding false alarms).
- The most effective clinical use of AI is as a "second opinion" to confirm your own findings and, crucially, to draw your attention to potential areas you may have missed.
In our next lesson, we will see how these same principles of image analysis are applied to a different, but equally important, diagnostic task: describing how AI measures alveolar bone loss to assist in classifying periodontal disease severity.