Hello! Welcome to your third lesson in the "Essential Mathematical Foundations" module.
In the last two lessons, we explored key concepts from linear algebra: eigenvalues/eigenvectors and matrix decompositions. We saw how these tools help us understand the fundamental properties and actions of matrices.
Today, we pivot to the final topic in this module: Calculus and Optimization. This is a critical area for machine learning, as training most models involves finding the minimum of a "loss" or "cost" function. The techniques we'll cover are the single-variable foundation for these large-scale optimization problems.
Our learning outcome is to apply first and second derivative tests to find maxima and minima of single-variable functions. We'll focus on the core procedures and the intuition behind them, which is exactly what you need for a rapid overview for your GATE exam.
1. The Goal: Finding Peaks and Valleys
In optimization, we are interested in finding the extrema of a function—its maximum and minimum values.
- A local maximum is a point that is higher than all its immediate neighbors. It's a "peak" in the local landscape.
- A local minimum is a point that is lower than all its immediate neighbors. It's a "valley" in the local landscape.
At these peaks and valleys (for a smooth, differentiable function), the tangent to the curve is perfectly horizontal. This means the slope, or the first derivative, is zero. We call these points stationary points or critical points.

2. Step 1: Finding Stationary Points
The first step in any optimization problem is to find the candidates for maxima and minima. As we've just discussed, this means finding the points where the first derivative is zero.
The process is straightforward:
- Given a function , find its first derivative, .
- Set the derivative to zero: .
- Solve this equation for . The solutions are the x-coordinates of your stationary points.
To see this process in action, let's watch a short video that walks through an example.
Differentiation (Maxima and Minima)
The following video from 1st Class Maths clearly explains what stationary points are and demonstrates how to find their coordinates.
Watch the video from the beginning until 03:23. Focus on: The definition of a stationary point (where the gradient is zero). The step-by-step process of differentiating, setting the derivative to zero, and solving for x. How to find the corresponding y-coordinates to get the full coordinate pairs of the stationary points.
Once we have these stationary points, we need a way to determine whether each one is a maximum, a minimum, or neither. This is where the derivative tests come in.
3. Step 2: Classifying Stationary Points
There are two primary methods for classifying stationary points.
Method A: The Second Derivative Test
The second derivative, , tells us about the concavity of the function. It measures the rate of change of the slope.
- If , the slope is increasing. The curve is shaped like a 'U' (concave up).
- If , the slope is decreasing. The curve is shaped like an 'n' (concave down).
This gives us a very direct test. For a stationary point (where ):
- If , the point is a local minimum. (Concave up, like a valley)
- If , the point is a local maximum. (Concave down, like a peak)
- If , the test is inconclusive. We can't draw a conclusion from the second derivative alone and must use the first derivative test.
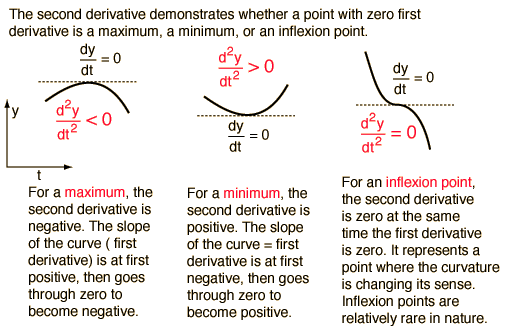
Let's continue with the same video to see a highly intuitive explanation and a worked example of this test.
Differentiation (Maxima and Minima)
This segment provides an excellent intuition for why the second derivative test works, followed by a practical example.
Watch the segment from 03:49 to 09:05. Pay close attention to: The explanation of the second derivative as the 'rate of change of the gradient'. The logic for why a negative f''(x) implies a maximum and a positive f''(x) implies a minimum. The step-by-step application of the test in the example.
Method B: The First Derivative Test
This test is more general and works even when the second derivative test is inconclusive. Here, we analyze the sign of the first derivative, , on either side of the stationary point .
- If changes from positive to negative at , the function goes from increasing to decreasing. This means is a local maximum.
- If changes from negative to positive at , the function goes from decreasing to increasing. This means is a local minimum.
- If does not change sign at (e.g., positive on both sides), then is neither a maximum nor a minimum. It is likely a point of inflection.
For the GATE exam, you need fast methods. The "wavy curve method" is a quick way to analyze the sign of the derivative, especially for polynomial functions.
Local Maxima & Minima | Maxima Minima Engineering Mathematics | BYJU'S GATE
The following video from BYJU'S Exam Prep demonstrates the 'wavy curve method'—a useful trick for quickly applying the first derivative test.
Watch from 01:20 to 05:25. Focus on: How to draw the wavy curve based on the roots of the derivative. How a sign change from '-' to '+' indicates a minimum, and '+' to '-' indicates a maximum. What happens at a repeated root (where the sign doesn't change), identifying a point of inflection.
4. Summary of the Tests
To consolidate these rules, it's helpful to have a concise reference. The following document provides a clear, formal summary of both tests.
Please read this summary sheet from the University of Washington. It formally lays out the first and second derivative tests.
Read the section titled 'Step 3b: If you are asked to classify the critical points...'. It clearly defines 'Option 1: The First Derivative Test' and 'Option 2: The Second Derivative Test'. This will serve as a great quick reference sheet.
This resource also includes several worked examples that you can review later if you wish to see more applications of these tests.
Conclusion
In this lesson, we've covered the fundamental calculus techniques for finding and classifying the maxima and minima of single-variable functions. This process of optimization is central to training machine learning models, where the "function" is a cost function and the "minimum" represents the best possible model parameters.
Key Takeaways:
- Stationary points are candidates for maxima or minima, found by setting the first derivative to zero ().
- The Second Derivative Test is often the fastest way to classify a stationary point :
- local minimum.
- local maximum.
- inconclusive.
- The First Derivative Test is a more general method. It checks the sign of around the stationary point :
- Sign change
+to-local maximum. - Sign change
-to+local minimum. - No sign change neither (e.g., point of inflection).
- Sign change
Preview of the Next Lesson:
We will conclude our tour of calculus by looking at Taylor series. While today's topic was about finding exact maxima and minima, Taylor series are about approximating a complex function with a simpler polynomial around a specific point. This is another powerful tool that relies on derivatives to understand a function's local behavior.