Hello! In our last lesson, we successfully calculated the surface normal for a sphere at a given intersection point. This was a critical step, giving us the vector that defines how the surface is oriented.
This lesson is dedicated to the learning outcome: visualize surface normals as colors to debug intersection calculations. While we touched upon this as a verification step previously, we will now formalize the technique. This is more than just a neat visual trick; it's a fundamental debugging practice in graphics programming. In your work as a pipeline TD, you've likely encountered "normal passes" or AOVs (Arbitrary Output Variables) from renderers like Arnold or Karma. This lesson covers the foundational principle behind generating those passes. We'll solidify the concept and refactor our code to be more robust, setting the stage for handling more complex scenes.
Why Visualize Normals? The Power of Visual Debugging
When writing a ray tracer, you're dealing with millions of pixels, each with its own ray, potential intersections, and calculated data. Trying to verify this by printing numbers to a console is impractical. By mapping data like a normal vector to an RGB color, you gain immediate, intuitive insight into your program's behavior across the entire image.
- A smooth, colorful gradient across a curved surface tells you the normals are being calculated correctly.
- Sudden, sharp changes in color or bizarre patterns can instantly flag bugs in your intersection math or normal calculation.
This practice of outputting data as colors is a cornerstone of graphics debugging.
The Technique: Mapping a Vector to a Color
As we discussed, the core idea is to map the three components of a normal vector to the three channels of an RGB color .
A normal is a unit vector, so its components lie in the range . However, color channels are typically represented in the range . We need a simple transformation to map one range to the other.
The formula for this is:
where is a vector of . This scales the range down to and then shifts it up by 0.5, resulting in the desired range.
To see this in action and reinforce your understanding, the following video explains and implements this exact technique.
LIGHTING AND SHADING // Ray Tracing series
This clip from The Cherno's excellent ray tracing series demonstrates how to calculate the normal for a sphere at the origin and then remaps its [-1, 1] range to the [0, 1] color range for visualization. This provides a great visual walkthrough of the code you'll be writing.
Watch from 22:43 to 26:32. Pay close attention to the logic at the end for converting the normal vector into a color value: (normal * 0.5) + 0.5.
Refactoring for Cleaner Intersections
In our previous code, the hit_sphere function returned a single double representing the intersection distance t. This was simple, but it forced our main ray_color function to recalculate the hit point and the normal. A much cleaner, more scalable approach is to have the intersection function return all the relevant data in one package.
This is where a hit_record struct comes in. It's a simple container for all the information about a ray-object intersection:
point3 p: The 3D coordinates of the intersection point.vec3 normal: The surface normal at the intersection point.double t: The ray parametertof the intersection.
Let's see how the Ray Tracing in One Weekend series introduces this concept. This is a crucial step towards building an abstraction for any object that can be hit by a ray, which we'll tackle in a future module.
Ray Tracing in One Weekend Series
This section from Ray Tracing in One Weekend introduces the idea of an abstract 'hittable' class and, more importantly for us right now, the hit_record struct. It shows how to bundle intersection data together.
Read the subsections "An Abstraction for Hittable Objects" and the code for the hittable.h file. Focus on the definition of the hit_record class. We will not be implementing the full hittable abstract class yet, but understanding the hit_record is key.
With this hit_record struct, we can refactor our hit_sphere function. Instead of returning a double, it will now return a bool (indicating if a hit occurred) and populate a hit_record passed by reference.
Here is what the signature and logic would look like:
// Before
double hit_sphere(const point3& center, double radius, const ray& r);

// After
bool hit_sphere(const point3& center, double radius, const ray& r, hit_record& rec);
Inside the new hit_sphere function, if you find a valid intersection at distance t, you would then populate the rec object:
// ... inside hit_sphere, after finding a valid root 't' ...
rec.t = root;
rec.p = r.at(rec.t);
vec3 outward_normal = (rec.p - center) / radius;
rec.normal = outward_normal; // We'll refine this part in a later lesson
return true;
Putting It All Together: The Final Image
Now, we can update our ray_color function to use this new, cleaner structure. It no longer needs to calculate the normal itself; it just receives it from the hit_record.
The updated code flow is much clearer:
- Check for an intersection using the new
hit_spherefunction. - If there's a hit, the
hit_recordis now filled with data. - Use
rec.normaland our remapping formula to return the final color.
The book Ray Tracing in One Weekend provides the definitive implementation of this.
Ray Tracing in One Weekend Series
This section contains the updated ray_color function that visualizes the normal. It perfectly demonstrates the logic you need to implement.
Read the subsection "Shading with Surface Normals" and focus on the ray_color function in the final code block. Notice how it calls hit_sphere, and if it hits, it uses the computed normal N to return the color 0.5*color(N.x()+1, N.y()+1, N.z()+1).
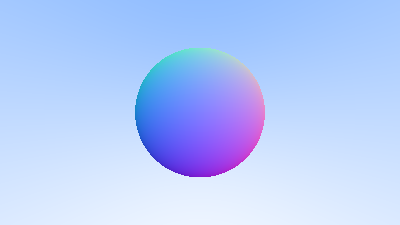
After implementing these changes, your rendered image should look like this, confirming that your normal calculations are correct for every point on the sphere.
Test your understanding!
A normal vector at a certain point on the sphere is calculated to be (-1, 0, 0), pointing directly left along the X-axis. After applying the remapping color = 0.5 * (normal + 1), what will the final RGB color value be for that pixel?
Show answer
Let's apply the formula to each component:
- Red:
0.5 * (normal.x + 1) = 0.5 * (-1 + 1) = 0.5 * 0 = 0 - Green:
0.5 * (normal.y + 1) = 0.5 * (0 + 1) = 0.5 * 1 = 0.5 - Blue:
0.5 * (normal.z + 1) = 0.5 * (0 + 1) = 0.5 * 1 = 0.5
The final RGB color would be (0, 0.5, 0.5), which is a dark cyan. This seems counter-intuitive (shouldn't it be black?), but the book's code and image show that the background contributes a blue-ish tint, and the sphere itself is colored relative to the camera's axes. The left side of the sphere in the example image is indeed cyan/blue, not pure black. The key is understanding the mapping.
Conclusion
Congratulations! You have now mastered a fundamental debugging technique in computer graphics and have made your intersection code more robust and scalable. This is a crucial checkpoint before we start building more complex scenes.
Key Takeaways:
- Visualizing data, especially vectors like normals, by mapping them to colors is an essential and powerful method for debugging graphics code.
- The mapping from a normal's component range to a color's range is achieved with the simple formula:
color = 0.5 * (normal + vec3(1, 1, 1)). - Refactoring your intersection functions to use a
hit_recordstruct to return all intersection data is a cleaner, more scalable design that you will build upon throughout this course.
Next Steps
With our sphere intersection and normal visualization code on solid footing, we are now ready to tackle the topic you expressed interest in early on: building a flexible camera system. In the next lesson, we will begin Module 4: Positionable Camera and Scene View. You will learn how to:
- Define a camera's position and orientation in 3D space using
lookfrom,lookat, andview-upvectors. - Implement an adjustable field of view to control the camera's zoom.
This will empower you to move around your scene and view your creations from any angle, a significant step towards creating compelling 3D images.