In our previous lesson, we used Spearman's rank correlation to measure the consistent, monotonic relationship between two variables, like a lingerie's sheerness and a model's preference. This is invaluable for one-to-one comparisons. However, a successful photoshoot relies on a shared creative vision among multiple stakeholders. What if your model, photographer, and stylist all have opinions? How do you measure if they are aligned or working at cross-purposes?
This lesson directly addresses that challenge. We will explore Kendall's Coefficient of Concordance, or Kendall's W, a powerful statistic for measuring agreement among three or more raters. You will learn to calculate and interpret W to determine if your creative team has a unified perspective on which lingerie styles are best for the shoot. This skill is crucial for ensuring consensus and making confident final selections.
From Paired Agreement to Group Consensus: Kendall's W
While Spearman's is excellent for comparing two sets of ranks, it falls short when you have three or more judges. You could calculate the average of all pairwise Spearman correlations, but Kendall's W provides a more direct and elegant solution for measuring the overall concordance (agreement) within a group.
Kendall's W quantifies the extent to which multiple raters agree in their ranking of a set of items. It is a non-parametric statistic that operates on ranked data, just like Spearman's rho.
The key properties of W are:
- It ranges from 0 to 1.
- W = 1 indicates perfect agreement among all raters.
- W = 0 indicates no agreement (i.e., the rankings are essentially random with respect to each other).
Unlike a typical correlation coefficient, W does not take negative values when there are more than two raters. Conceptually, a group can either agree or fail to agree; a collective "negative" agreement isn't a coherent idea.
The following reading provides a formal introduction to the concept.
[PDF] 12 Measures of Association and Item Analysis - AgreeStat
This section from the textbook Measures of Association and Item Analysis formally defines Kendall's W (referred to as KCC) and its purpose.
Read the section 12.5 Kendall’s Coefficient of Concordance (KCC) on page 360 of the PDF. Focus on the core definition: it's a measure for "three raters or more" that varies from 0 (total absence of agreement) to 1 (complete agreement).
The Logic Behind the Calculation
Given your statistics background, you'll appreciate the intuition behind the formula for W. It's based on comparing the variance of the sums of ranks.
Let's define the terms:
- : The number of items being ranked (e.g., 7 lingerie styles).
- : The number of raters (e.g., 3 people: model, stylist, photographer).
- : The sum of the ranks assigned to item by all raters.
If all raters are in perfect agreement, certain items will consistently receive low ranks (e.g., 1, 1, 1) and others will consistently receive high ranks (e.g., 7, 7, 7). This will cause the sums of ranks () to be very spread out. Conversely, if there is no agreement, the ranks will be mixed randomly, and the rank sums () for all items will be very similar to each other.
Kendall's W is essentially the ratio of the variance of the observed rank sums to the maximum possible variance of rank sums (which occurs at perfect agreement).
The primary formula for W is:
where is the sum of squared deviations of the rank sums from their mean, i.e., .
The video below provides an excellent practical walkthrough of calculating W in Excel. It clearly demonstrates how to calculate the sum of ranks and the value of S, which is the core of the numerator.
Kendall's Coefficient of Concordance (Kendall's W) in Excel
This video, "Kendall's Coefficient of Concordance (Kendall's W) in Excel" by Dr. Todd Grande, provides a step-by-step demonstration.
Watch the following segments to understand the calculation process: First, see how the data is set up from the introduction. Note the definitions of 'n' (items, which we call 'k') and 'm' (raters). Next, focus on the calculation of the numerator term 'S' from this segment. The video explains how Excel's DEV.SQ function calculates the sum of squared deviations of the rank sums, which is exactly what S represents. Finally, watch how the denominator is calculated and combined with the numerator to find W from this part.
Numerical Exercise: The "Aphrodite" Photoshoot Panel
Let's apply this to your project. You've shortlisted 7 lingerie pieces for the "Aphrodite" photoshoot. To ensure a cohesive vision, you ask your Model, Stylist, and Photographer to rank these 7 pieces from 1 (most preferred) to 7 (least preferred).
Here are their rankings:
| Lingerie Piece | Style | Model's Rank | Stylist's Rank | Photographer's Rank |
|---|---|---|---|---|
| 1 | Lace Bodysuit | 2 | 1 | 2 |
| 2 | Silk Robe | 7 | 6 | 7 |
| 3 | Mesh Teddy | 1 | 3 | 1 |
| 4 | Cotton Bralette | 6 | 7 | 6 |
| 5 | Satin Chemise | 4 | 5 | 5 |
| 6 | Garter Belt Set | 3 | 2 | 4 |
| 7 | Strappy Panty | 5 | 4 | 3 |
Your task is to calculate Kendall's W to measure the team's agreement.
Your Task:
- Calculate the sum of ranks () for each lingerie piece. Add a new column to the table for this.
- Calculate the mean of the rank sums ().
- Calculate , the sum of squared deviations. For each piece, find and then sum these values.
- Calculate W using the formula, with raters and pieces.
Click to see the detailed solution.
Step 1: Calculate the sum of ranks ().
| Lingerie Piece | Model | Stylist | Photographer | Rank Sum () |
|---|---|---|---|---|
| 1 | 2 | 1 | 2 | 5 |
| 2 | 7 | 6 | 7 | 20 |
| 3 | 1 | 3 | 1 | 5 |
| 4 | 6 | 7 | 6 | 19 |
| 5 | 4 | 5 | 5 | 14 |
| 6 | 3 | 2 | 4 | 9 |
| 7 | 5 | 4 | 3 | 12 |
| Total | 84 |
Step 2: Calculate the mean of the rank sums ().
Step 3: Calculate S, the sum of squared deviations.
| Piece | |||
|---|---|---|---|
| 1 | 5 | -7 | 49 |
| 2 | 20 | 8 | 64 |
| 3 | 5 | -7 | 49 |
| 4 | 19 | 7 | 49 |
| 5 | 14 | 2 | 4 |
| 6 | 9 | -3 | 9 |
| 7 | 12 | 0 | 0 |
| Sum |
So, .
Step 4: Calculate W.
We have , raters, and pieces.
The Kendall's W for this data is 0.889, which indicates a very high level of agreement among the model, stylist, and photographer.
Is the Agreement Statistically Significant?
A high value of W like 0.889 is promising, but is it statistically significant? Or could this level of agreement have happened by chance? To answer this, we can perform a hypothesis test.
- Null Hypothesis (): The rankings provided by the raters are independent of each other (i.e., there is no agreement).
- Alternative Hypothesis (): The rankings are not independent (i.e., there is agreement).
For this test, Kendall's W can be approximated by a Chi-Square () distribution. The test statistic is calculated as:
This statistic follows a distribution with degrees of freedom.
Let's test the significance of our result from the numerical exercise.
- , ,
Using a chi-square calculator or table for with 6 degrees of freedom, we get a p-value of approximately 0.014. Since , we reject the null hypothesis. We can conclude that there is a statistically significant level of agreement among the creative team.
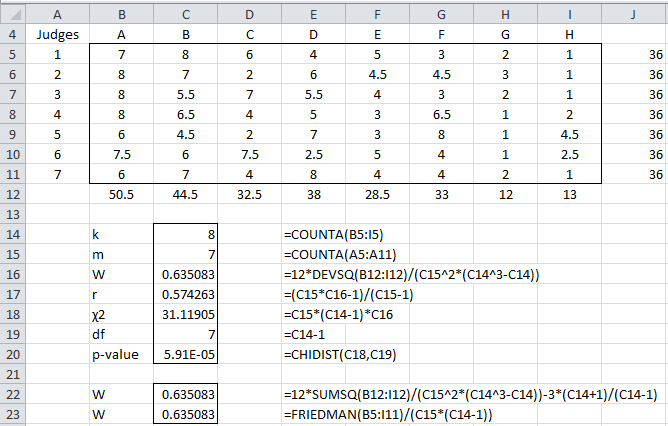
The following resource provides a worked example (using different data for movies and judges) that perfectly illustrates how the ranking data, the calculation of W, and the subsequent Chi-Square test all fit together.
Kendall's Coefficient of Concordance (W) - Real Statistics Using Excel
This article from Real Statistics Using Excel provides a complete, worked-out example.
Focus on Example 1. This example, shown in "Figure 1," has a structure very similar to our lingerie problem. Notice how it calculates W and then immediately uses it to find the \chi^2 value and the p-value to test for significance.
The image below is the "Figure 1" from the article, showing all the calculations in a spreadsheet format. This is a great reference for how you might structure your own analysis.
It's also worth noting the close relationship between Kendall's W and the Friedman test, another non-parametric method you may have encountered. The statistic used here is mathematically equivalent to the one used in Friedman's test, which is designed to detect differences between several related samples. This connection highlights the robust theoretical underpinnings of the methods we are using.
Conclusion
In this lesson, you have learned how to quantify and test the significance of agreement among multiple raters using Kendall's W. This is a critical step in your project's "Style Optimization" phase, ensuring your creative team is aligned before the final photoshoot. A high, significant W value gives you the confidence to proceed, while a low value is a clear signal that a discussion is needed to reconcile different creative visions.
Key Takeaways:
- Kendall's W measures the concordance (agreement) among three or more sets of ranks.
- The value of W ranges from 0 (no agreement) to 1 (perfect agreement).
- The significance of W can be tested using a Chi-Square () test, which tells you if the observed agreement is greater than what would be expected by chance.
- A high W provides a solid, quantitative basis for claiming your creative team has a shared vision.
So far, we have focused on relationships and agreement at a single point in time. However, lingerie design is also about understanding trends. In our next lesson, we will shift gears to model the lifespan of a fashion trend using the exponential distribution, exploring concepts like survival functions and hazard rates to predict when a style might be fading.