Hello! Welcome to the Capstone Project.
Over the last ten modules, you have built a solid foundation for teaching AI concepts to industry managers. We've journeyed from high-level AI strategy, through the critical importance of data quality, into the practical, hands-on worlds of Power Query for data cleaning and Power BI for visualization and reporting. Your last lesson on sharing insights was the final piece of the puzzle, completing the end-to-end workflow.
Now, it's time to bring it all together. This module is where you'll apply everything you've learned to a single, comprehensive project. You will take a raw, messy dataset and transform it into a powerful decision-making tool.
This first lesson of the capstone project focuses on the foundational first step. We will tackle the learning outcome: Apply a sequence of Power Query steps to clean and prepare a provided raw dataset. You will act as the project lead, taking a typical business dataset and systematically cleaning it, creating a solid foundation for the analysis and visualization that will follow in the next lessons.
The Capstone Scenario: Cleaning Sales Data
For this project, imagine you have received a raw data export of quarterly sales and operations data. The data is messy, inconsistent, and contains errors—a perfect reflection of what managers often face in the real world. Your goal is to clean this data and make it reliable and ready for analysis.
Here's a profile of the "Raw Sales Data" we will be working with. It contains columns like:
OrderIDProduct NameCategorySales RepCustomer Namecustomer_location(e.g., "New York, NY")order_dateUnits SoldUnit PriceTotal Revenue(with a trailing space)Notes(internal tracking notes)_status_code(an irrelevant system code)
The data suffers from common issues: duplicate orders, formatting inconsistencies, missing values, incorrect data types, and unnecessary information. Our task is to methodically fix these problems.
Your Data Cleaning Workflow
A structured approach is key to data cleaning. We will follow a logical sequence of steps. This sequence is not just a technical exercise; it's a teachable framework you can pass on to the managers in your workshop.
The article "How To Clean Data Using Power Query" provides an excellent 10-step overview that we can use as our guide.
How To Clean Data Using Power Query: 10 Step Process
To frame our work, let's start with this article from Intellisoft. It provides a high-level, 10-step process for data cleaning in Power Query. This will serve as the blueprint for our capstone data preparation task.
Please read the '10-Step Process to Clean Data Using Power Query in Power BI' list at the beginning of the article. This gives you the full sequence we'll be following, from loading data to applying our changes.
Now, let's execute that plan.
Step 1: Load Data into Power Query
First, get the data into the Power Query Editor. This is the gateway to all transformations. In your workshop, you'll provide the managers with a messy Excel or CSV file.
How-to:
- In Power BI Desktop or Excel, go to the Data tab.
- Select Get Data (from Excel workbook, Text/CSV, etc.).
- After loading, click Transform Data to open the Power Query Editor.
This initial step is well-covered in the "Power Query For Data Preparation In Excel" guide.
Step 2: Initial Structural Cleanup (Remove & Rename)
A good first pass involves removing data you don't need and making sure your column headers are clean and descriptive.
- Remove Unnecessary Columns: Our dataset has
Notesand_status_code. These aren't needed for sales analysis. Select them (using Ctrl-click), right-click, and choose Remove Columns. This reduces clutter and focuses your dataset. - Rename Columns: The
Total Revenuecolumn has a trailing space. This can cause errors later. Double-click the header and rename it toTotal Revenue.
This short video clip demonstrates these two essential actions.
Top 10 Most Important Data Cleaning Methods in Power BI | Power BI
This video from Pivotalstats shows how to efficiently remove and rename columns. These are often the very first steps in tidying up a new dataset.
Watch the sections on removing columns (01:26 - 02:20) and renaming columns (03:53 - 04:40). Notice the 'Applied Steps' pane on the right recording every action.
Step 3: Remove Duplicate Records
Duplicate entries can inflate your totals and skew analysis. It's crucial to remove them early. In our scenario, we have duplicate OrderID entries.
How-to: Right-click the header of the column that should be unique (e.g., OrderID) and select Remove Duplicates.
Step 4: Clean and Standardize Text Data
Inconsistent text is a common problem. Our Sales Rep column might have entries like "smith, john", "Smith, John", and " smith, john ". We can fix this with a few transformations.
- Trim: Removes leading and trailing whitespace.
- Capitalize Each Word: Standardizes casing.
The video "Data Cleaning With Power Query" shows this text transformation process beautifully.
Data Cleaning With Power Query (Better than Excel)
Watch this segment from Kenji Explains to see how to apply multiple text transformations to clean up a messy 'Name' column.
Pay close attention from 02:55 to 04:04. The video demonstrates using 'Trim', 'Capitalize Each Word', and 'Replace Values' to standardize text fields.
Step 5: Handle Missing Values
Our Unit Price column may have missing values (nulls) for some records. Depending on the business context, you might remove these rows or replace the nulls. For our case, let's assume a missing price means the item was a no-cost promotional item, so we'll replace null with 0.
How-to: Right-click the Unit Price column header, select Replace Values, enter null in "Value To Find" and 0 in "Replace With".
Step 6: Filter Out Unwanted Rows
Sometimes, entire rows of data are irrelevant. For example, your dataset might contain orders with a future order_date due to data entry errors. You can filter these out.
How-to: Click the filter dropdown on the order_date column, go to Date Filters, and select a condition like In the Past or Before... a specific date.
Step 7: Restructure Data by Splitting Columns
Our customer_location column combines city and state ("New York, NY"). For better analysis (e.g., mapping or filtering by state), we should split this into two separate columns.
This process is detailed in the "Power Query For Data Preparation In Excel" walk-through.
Power Query For Data Preparation In Excel
This guide from EvalAcademy provides a clear, step-by-step tutorial on splitting columns.
Read the section 'Split Column by Delimiter'. It explains how to use a character (like a comma) to separate one column into two or more, which is exactly what we need for our 'customer_location' field.
Step 8: Finalize Data Types
This is a critical final step. Power Query makes a best guess for data types on import, but it often needs correction. Ensure that:
OrderIDis Text (it's an identifier, not a number for calculation).order_dateis Date.Units Soldis Whole Number.Unit PriceandTotal Revenueare Fixed decimal number or Currency.

Test your understanding!
You've cleaned your data, and all the values look correct. You notice that the Total Revenue column has the 'ABC' icon (Text type) next to its header instead of '1.2' (Decimal type). If you load this data into Power BI and try to create a bar chart showing revenue by category, what will likely happen?
Show answer
Power BI will not be able to sum the Total Revenue column because it sees the values as text, not numbers. Instead of a bar chart with sums, you would likely only be able to show a count of revenue entries for each category, which is not what you want. This is why setting the correct data type is essential.
Step 9: Review the "Applied Steps"
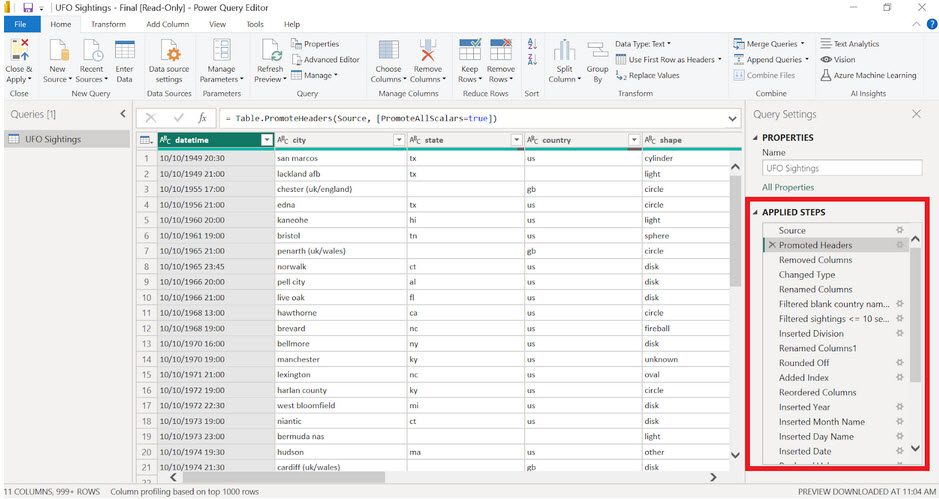
As you perform each cleaning action, Power Query records it in the Applied Steps pane on the right side of the editor. This is one of its most powerful features. It creates a repeatable, automated "recipe" for your data cleaning. If you get a new version of the raw data next quarter, you just need to point Power Query to the new file and hit "Refresh"—all these cleaning steps will be reapplied automatically.
Step 10: Close & Apply
Once you are satisfied with your cleaned data, click Close & Apply in the Home tab. This loads the clean, structured table into your Power BI data model, ready for the next stage: building your report.
Conclusion
Congratulations! You have just completed the first, and arguably most important, part of the capstone project. You've taken a messy, unreliable dataset and transformed it into a clean, trustworthy asset using a systematic and repeatable process in Power Query.
Key Takeaways for Your Workshop:
- Data cleaning is not optional. It's the foundation of any reliable analysis.
- Follow a logical sequence: Start with broad structural changes (removing columns, duplicates) and move to more detailed fixes (formatting, data types).
- Power Query automates the work. The "Applied Steps" pane means you only have to do the cleaning once. The process is now a reusable asset.
- Each cleaning step directly addresses a specific data quality issue, turning raw data into valuable information.
Preview of the Next Lesson:
With our clean data loaded and ready, we will move on to the next learning outcome of the capstone project: "Construct an interactive Power BI dashboard using the prepared data to answer specific business questions." We will take the clean table you've just created and start bringing it to life with visuals, charts, and filters to uncover insights and tell a compelling story.