Hello! Welcome to the final lesson in our module on "Sharing Insights and Collaboration."
In our last lesson, we focused on keeping your shared reports alive and current by setting up scheduled data refreshes. You now know how to teach managers to automate this crucial process, ensuring their teams are always working with the latest data.
Now, with our reports built, published, shared, and automatically updated, we arrive at the final step in the communication chain: presenting these insights to others. This lesson addresses the learning outcome: Export reports and visuals for use in presentations and documents. We will explore the different ways to get your Power BI content into the hands of stakeholders, whether through static documents or dynamic, interactive presentations.
For managers, this is where the rubber meets the road—turning data analysis into a compelling story during a team meeting or a formal report. We'll cover two main approaches: traditional static exports and the more modern, interactive live embedding.
Method 1: Static Exports for Documents and Records
The most straightforward way to share your findings is by exporting them as static images. This method is ideal when you need to create a permanent record (like a quarterly report) or share visuals with an audience who doesn't have Power BI access.
Exporting a Full Report to PowerPoint or PDF
Power BI allows you to export an entire report, where each page becomes a separate slide in a PowerPoint presentation or a page in a PDF document.
Export Entire Reports to PowerPoint - Power BI
The official Microsoft documentation provides a clear, step-by-step guide on this process. It explains exactly what happens during the export.
Please read the sections 'Export a report to PowerPoint', 'Export your Power BI report to PowerPoint', and 'Open the PowerPoint file'. Pay attention to what is included in the export, such as a link back to the original report and the data refresh timestamp. Also, note the options you have, like exporting with 'Current values' versus 'Default values'.
Key takeaways from this method:
- Process: In the Power BI Service, open your report and select Export > PowerPoint > Export as image.
- Result: You get a standard PowerPoint file. Each report page is a high-resolution, non-interactive image on its own slide.
- Benefit: It's simple, universally compatible, and preserves the report's state (including filters) at the moment of export.
- Exporting to PDF is a similar process, ideal for creating official, uneditable documents.

Copying a Single Visual
Sometimes, you don't need a whole report page—just one specific chart for an email or a Word document. For this, you can copy an individual visual directly to your clipboard.
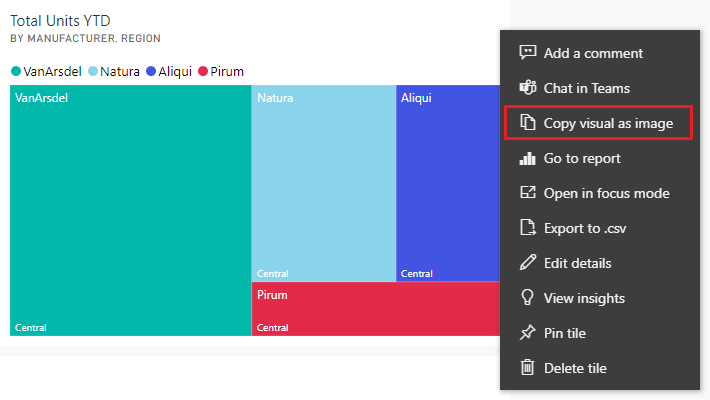
This method is incredibly useful for embedding a single, focused insight into a larger narrative without the clutter of an entire report page.
Method 2: Embedding Live, Interactive Reports in PowerPoint
While static exports are useful, they lose the primary advantage of Power BI: interactivity. Imagine being in a meeting and having a manager ask, "What does this look like for just the Western region?" With a static image, you'd have to say, "I'll get back to you." With a live embed, you can answer the question instantly.
This is made possible by the Power BI add-in for PowerPoint.
FINALLY! Properly Present Your Power BI Dashboard in PowerPoint (keep the interactivity)
This video by Leila Gharani provides an excellent demonstration of how to embed a live, interactive Power BI report directly into a PowerPoint presentation. It clearly shows the power of this integration.
Watch the following segments to understand the entire process: 00:19 - 00:54: The problem with static exports. 00:54 - 02:26: How to use the 'Embed live data' option to bring a report into a new PowerPoint file. 03:07 - 04:06: How to interact with the embedded report (filters, tooltips, page navigation). 03:52 - 05:11: How to add a live report to an existing PowerPoint presentation.
As the video shows, you can embed either an entire report page or even a single visual. The process involves getting a specific URL from the Power BI service and pasting it into the Power BI add-in within PowerPoint. The result is a fully functional Power BI report right on your slide.
A Critical Point to Teach: Permissions Matter
This is the single most important concept for your workshop participants to understand about live embedding.
- Live embeds are not self-contained. They are a secure window into the Power BI Service.
- To see the data, a person viewing the PowerPoint presentation must have a Power BI account and be granted permission to view the original report and its underlying dataset.
- If they don't have the necessary access, they will simply see a message indicating they cannot view the content.
FINALLY! Properly Present Your Power BI Dashboard in PowerPoint (keep the interactivity)
Let's revisit Leila Gharani's video for a concise explanation of the sharing requirements.
Watch the short clip from 09:23 to 09:46. This clearly states the security permissions required for a viewer to interact with the embedded report.
This security feature is a strength, as it ensures data governance is maintained, but it's a crucial logistical point that managers must plan for when sharing their presentations.
Test your understanding!
A project manager embeds a live Power BI sales report into a PowerPoint presentation. She sends the presentation to two people: her direct boss (who has Power BI Pro and access to the sales workspace) and a consultant from an external company (who does not have a Power BI account). What will each person see when they open the slide with the embedded report?
Show answer
- Her boss will see the fully interactive Power BI report and will be able to slice, filter, and explore the data directly within PowerPoint.
- The consultant will see a placeholder or an error message stating that they do not have permission to view the content. They will not see any data.
Advanced Control: Managing Your Embedded Content
Once you have a live report in PowerPoint, you have several options for managing how it's displayed and shared.
Freezing a View: Snapshots
Let's say you've filtered your live report to show a very specific insight. You can "freeze" that view by saving it as a static image directly on the slide. This is useful for creating a snapshot of the data to support a point, which you can then revert back to the live report.
This video from Access Analytic demonstrates this and introduces another powerful tool: the Power BI Controller.
💥 NEW Power BI + PowerPoint Integration: Full Demo & Tutorial!
This video from Access Analytic dives into a helpful add-in called the Power BI Controller, which gives you bulk control over all the Power BI elements in your presentation.
Please watch from 02:34 to 05:22. The first part (02:34 - 03:13) shows you where to find and install the add-in. The second, most important part (03:13 - 05:22) demonstrates how you can use the controller to switch all your embedded visuals between Live Data, Secure Snapshots (static image, requires permission), and Public Snapshots (static image, anyone can see).
The Power BI Controller is an excellent tool for preparing a presentation for different audiences. A manager could present interactively using the Live Data view in an internal meeting, and then, with one click, convert all visuals to Public Snapshots before sending the slide deck to an external audience.
Summary of Export and Sharing Methods
To help your workshop participants make the right choice, here's a simple guide you can use:
| Scenario | Recommended Method | Why? |
|---|---|---|
| Presenting to an internal team where Q&A is expected. | Embed live data in PowerPoint. | Allows for full interactivity to answer questions on the fly. The audience has Power BI access. |
| Creating an official quarterly report for archival. | Export to PDF. | Creates a static, uneditable, and time-stamped document that serves as a permanent record. |
| Sending a key metric in a weekly team email. | Copy visual as an image. | Fast, simple, and embeds the visual directly into the email body for a quick update. |
| Sharing a presentation with external partners who don't use Power BI. | Embed live data, then convert to Public Snapshots. | Allows the presenter to use the live version but distribute a static, viewable-by-all version of the slides. |
Conclusion
You are now prepared to teach managers the final, crucial step of the data journey: effectively communicating their findings. By understanding the difference between static exports and live embeds, they can choose the right tool for the right audience, ensuring their data-driven stories are both impactful and secure.
Key Takeaways for Your Workshop:
- Static Exports (Image, PDF): Best for permanent records and sharing with audiences who do not have Power BI access. They are simple but not interactive.
- Live Embeds in PowerPoint: The most powerful way to present, allowing full interactivity during a presentation.
- Permissions are Key: Live embeds require the viewer to have both a Power BI account and access to the specific report.
- Use Snapshots for Control: You can freeze live reports into static images for broader sharing, either one-by-one or for the whole presentation using the Power BI Controller add-in.
Preview of the Next Lesson:
This lesson concludes our modules on the core tools and techniques. You have now covered the entire workflow from cleaning raw data to sharing finished, automated reports. In our final module, the Capstone Project, you will apply all these skills in a single, comprehensive exercise. You will be given a raw dataset and a set of business questions, and your task will be to build a complete solution from data preparation in Power Query to a final, shareable Power BI dashboard.