Hello! Welcome back to the capstone project.
In our last lesson, you successfully transformed a raw, messy sales dataset into a clean, structured table using Power Query. That was the essential groundwork. Now, with a reliable dataset at our fingertips, we can move to the exciting part: turning that data into a compelling visual story.
This lesson directly addresses the next learning outcome of our project: Construct an interactive Power BI dashboard using the prepared data to answer specific business questions. We will take the clean data you prepared and build a dashboard from scratch, focusing on how each element helps answer practical business questions. This is the core skill you'll be teaching managers—transforming clean data into actionable insights.
Part 1: Planning Your Dashboard - From Data to Decisions
Before we drag and drop a single chart, it's crucial to define our purpose. A great dashboard isn't just a collection of charts; it's a focused tool designed to answer specific questions. As you'll teach the managers, this planning phase is what separates a confusing report from a powerful decision-making tool.
To guide this process, let's review the key planning steps involved in any dashboard project.
Build Power BI Interactive Dashboards A Step-by-Step Guide
The article 'Build Power BI Interactive Dashboards' from Brainvire provides an excellent overview of the planning process. This strategic thinking is a critical skill for managers to learn before they even open Power BI.
Please read section 3, 'Planning Your Dashboard Project'. Focus on the 'Key Planning Steps': identifying business objectives, determining stakeholders, and defining KPIs. This is the 'why' behind the dashboard.
Defining Our Business Questions
For our capstone project, let's assume we need to present a performance overview to regional sales managers. Based on this, we can define a few key business questions to answer with our dashboard:
- Overall Performance: What are our total sales and profit? How many units have we sold?
- Performance Over Time: How do our sales trend month-over-month? Is there any seasonality?
- Top Performers: Which product categories are driving the most sales?
- Geographic Performance: Which regions or cities are our biggest markets?
- Detailed Breakdown: Can we see a detailed summary of financials for each product?
With these questions in mind, we can now select the right visuals to answer them.
Part 2: Building Your First Dashboard
Now, let's open Power BI and start building. We'll construct our dashboard piece by piece, with each visual corresponding to one of our business questions. The end result will look something like the dashboards you see here, which combine multiple visuals into a single, cohesive view.
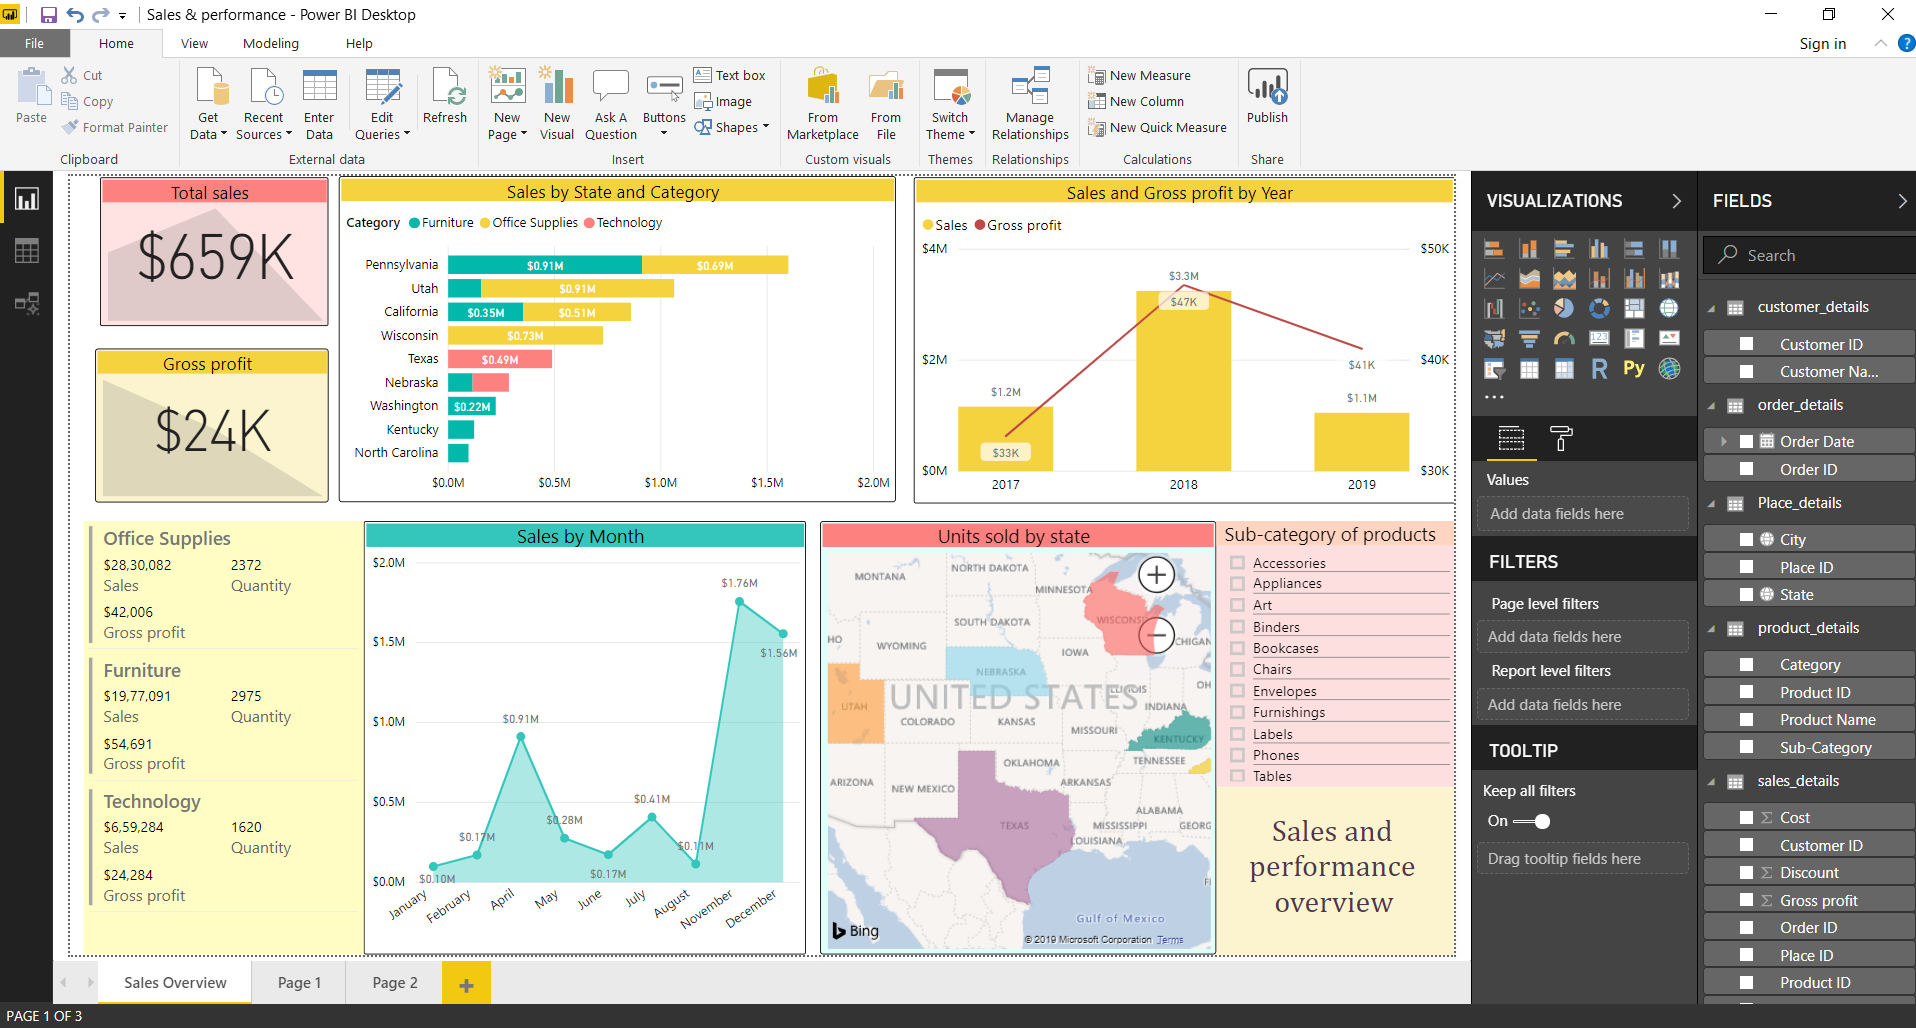
The following video is an excellent end-to-end tutorial that demonstrates the creation of a complete dashboard. We will use its workflow as our primary guide for this hands-on section.
Power BI Tutorial For Beginners | Create Your First Dashboard Now (Practice Files included)
The 'Power BI Tutorial For Beginners' by Leila Gharani is a fantastic, practical guide. It covers importing data, building a variety of essential visuals, adding interactivity, and publishing the final report. We will follow its structure to build our own dashboard.
Watch the video from 08:34 to 19:37. This is the core of our lesson. Pay close attention to how different visuals (bar charts, tables, maps, line charts) are created and how slicers are added to enable filtering. Note how the relationships between tables (08:34 - 10:41) are the foundation for making all the visuals work together.
Let's break down the creation process based on our questions and the techniques shown in the video.
Step 1: Answering "Overall Performance" with KPI Cards
- Question: What are our total sales and profit?
- Visual: Card (or KPI card).
- How-to:
- Click on the Card visual in the Visualizations pane.
- Drag your main measure, like
Total Revenue, into the 'Fields' well. - Repeat this for other key metrics like
Units SoldandProfit(if you created this column).
- Purpose: Cards are perfect for displaying the most important, high-level numbers that managers want to see at a glance. Place them prominently at the top of your dashboard.
Step 2: Answering "Top Performers" with a Bar Chart
- Question: Which product categories are driving the most sales?
- Visual: Clustered bar chart.
- How-to:
- Select the Clustered bar chart visual.
- Drag the category field (e.g.,
Category) to the Y-axis. - Drag the value field (e.g.,
Total Revenue) to the X-axis.
- Purpose: Bar charts are ideal for comparing values across different categories.
Step 3: Answering "Performance Over Time" with a Line Chart
- Question: How do our sales trend month-over-month?
- Visual: Line chart.
- How-to:
- Select the Line chart visual.
- Drag your date field (e.g.,
order_date) to the X-axis. Power BI will automatically create a date hierarchy (Year, Quarter, Month, Day). You can use 'Month'. - Drag the value field (e.g.,
Total Revenue) to the Y-axis.
- Purpose: Line charts are the standard for showing trends over a continuous period, like time.
Step 4: Answering "Geographic Performance" with a Map
- Question: Which regions or cities are our biggest markets?
- Visual: Map.
- How-to:
- Select the Map visual.
- Drag your location field (e.g.,
CityorState) to the 'Location' field. - Drag your value field (e.g.,
Total Revenue) to the 'Bubble size' field.
- Purpose: Maps instantly turn location data into a powerful visual insight, showing geographic concentrations and hotspots.
Step 5: Answering "Detailed Breakdown" with a Matrix
- Question: Can we see a detailed summary of financials for each product?
- Visual: Matrix.
- How-to:
- Select the Matrix visual.
- Drag a category like
Product Nameto the 'Rows' field. - Drag multiple numerical fields like
Units Sold,Unit Price(set to Average), andTotal Revenueto the 'Values' field.
- Purpose: A matrix is like a pivot table in Excel. It's perfect for displaying detailed, tabular data with multiple measures. The Kenji Explains video provides another great example of setting this up.
Part 3: Making Your Dashboard Interactive
A static report is informative, but an interactive one is empowering. Interactivity allows managers to explore the data themselves, ask their own questions, and uncover deeper insights.
The Brainvire article you read earlier introduced the key features that enable this.
Build Power BI Interactive Dashboards A Step-by-Step Guide
Let's revisit the Brainvire article to formally define the interactivity features we're about to implement.
Quickly review section 7, 'Making It Interactive'. This section lists and explains features like Slicers, Drillthroughs, and the Q&A box, which transform a static report into an analytical tool.
Implementing Interactivity
-
Slicers: Slicers are on-canvas filters. Let's add one for
Year.- Click on the Slicer visual in the Visualizations pane.
- Drag the
Yearpart of yourorder_datehierarchy into the 'Field' well. - Now, managers can click a year (e.g., 2020) and the entire dashboard will update to show data for only that year.
-
Cross-Filtering: This is a default behavior in Power BI and it's incredibly powerful. When you click on a data point in one visual, it filters the others.
- Try it: On your dashboard, click on a single bar in your "Sales by Category" chart.
- Observe: Watch how the map, the line chart, and the KPI cards all update to reflect the data for only that category. Clicking the bar again (or on a blank space) removes the filter.
Test your understanding!
You've built a dashboard containing a map of sales by state and a bar chart of sales by product category. A manager wants to know which product categories are most popular specifically in Texas. What is the quickest way for them to find this information using the interactive dashboard?
Show answer
The manager can simply click on the bubble or shape representing Texas on the map. Due to Power BI's automatic cross-filtering, the bar chart will instantly update to show the sales for each product category for Texas only.
Conclusion
In this lesson, you have taken the crucial step of turning clean data into a dynamic, interactive business tool. You started by defining the business questions, then methodically selected and built visuals to answer them. Finally, you layered in interactivity with slicers and cross-filtering, empowering users to explore the data on their own.
Key Takeaways for Your Workshop:
- Plan First, Build Second: Always start by defining the questions you need to answer.
- Choose the Right Visual for the Job: Use bar charts for comparisons, line charts for trends, maps for locations, and cards for KPIs.
- Interactivity is Key: Slicers and cross-filtering transform a report from a static picture into an exploratory experience.
- Tell a Story: The arrangement of your visuals should guide the user through a logical narrative, from a high-level overview (KPIs) down to the details (matrix).
Preview of the Next Lesson:
You have now built a fantastic, functional dashboard. But what if you want to find insights that aren't immediately obvious? In our next lesson, we will explore Power BI's built-in AI features. You will learn how to integrate insights from an AI-powered visual to enrich the dashboard's narrative, uncovering the key drivers and root causes behind your data automatically.