Hello! Welcome to the next stage of our capstone project.
In the last lesson, you did an excellent job constructing an interactive dashboard that answers the crucial "what" questions about our business—what are our sales, what are the trends, and what are our top-performing categories. This is the foundation of any good business report.
Today, we're going to elevate that dashboard. We'll move beyond describing what happened and start exploring why it happened. This lesson is designed to help you master the learning outcome: Integrate insights from an AI-powered visual to enrich the dashboard's narrative. You'll learn how to use Power BI's built-in artificial intelligence to automatically uncover patterns, root causes, and stories hidden in your data. This is the skill that transforms a standard report into a powerful strategic tool for the managers you'll be training.
Part 1: From "What" to "Why" - An Introduction to AI Visuals
The charts you've built so far are fantastic for showing performance. But when a manager sees a sales dip, their next question is always "Why?". Answering this traditionally requires a lot of manual analysis. Power BI’s AI visuals are designed to do this heavy lifting for you.
To get a sense of the tools available, let's start with a high-level overview.
How to Use AI Based Visuals in Power BI
The article 'How to Use AI Based Visuals in Power BI' provides a concise summary of the main AI visuals and the questions they are designed to answer. It’s a great map of the landscape.
Please read the section 'Complete Guide to Power BI's AI Visuals' and the sub-section 'Visual Selection and Setup' under 'Step-by-Step Implementation Guide...'. Focus on the mapping of questions to visuals. You don't need to dive deep into each one yet; just get familiar with the purpose of each.
As the article explains, each AI visual is a specialized analytical tool:
| If your question is... | Use this AI Visual... | Purpose |
|---|---|---|
| "What influences my metric?" | Key Influencers | Statistical driver analysis |
| "How is this number broken down?" | Decomposition Tree | Interactive root cause analysis |
| "Show me..." (using plain English) | Q&A | Natural language query |
| "Summarize what I'm seeing." | Smart Narrative | Automated text summary |
| "Why did this data point change?" | Analyze Feature | Explain increases/decreases in trends |
For this lesson, we will focus on Smart Narrative and the Decomposition Tree, as they provide an incredibly powerful combination for enriching a dashboard's story. We will also touch on the Analyze feature as a quick-analysis bonus.
Part 2: Automatically Generating the Story with Smart Narrative
The most direct way to "enrich the narrative" is to have AI write one for you. The Smart Narrative visual analyzes all the charts on your dashboard and generates a dynamic, text-based summary of the key insights. This is a perfect starting point for any presentation.
The following video demonstrates how to create and use Smart Narratives.
How to Use AI in Power BI to Make Smarter Dashboard?
This clip from Pavan Lalwani's video 'How to Use AI in Power BI' provides a clear, practical demonstration of adding a Smart Narrative visual and shows how it dynamically updates.
Please watch the video from 16:37 to 22:17. Pay close attention to how the narrative is generated based on all visuals on the page and how it changes when you interact with other charts (like selecting a segment).
Your Turn: Add a Smart Narrative
Now, let's apply this to the dashboard you built in the previous lesson.
- Open your Capstone Project Power BI file.
- Make sure no visuals are selected by clicking on the blank canvas of your report page.
- In the Visualizations pane, click the Smart Narrative icon.
- Power BI will automatically analyze your page and generate a text box filled with insights. Position and resize this box to fit your layout.
Notice the underlined values. These are dynamic. To see this in action, click on a bar in your 'Sales by Category' chart or a region on your map. Watch the text update in real-time. This is the feature's core power: it provides instant, context-specific commentary.
For a deeper dive into customizing these narratives, the official Microsoft documentation is an excellent resource to keep for reference. You can review it now or bookmark it for later.
Create Smart Narrative Summaries - Power BI
Microsoft's official guide, 'Create Smart Narrative Summaries', details how to edit the text, add your own custom dynamic values using natural language, and format them.
Skim through this documentation. Focus on the concepts of editing the summary and using 'dynamic values'. This shows you how to move beyond the auto-generated text and tailor the narrative for your specific audience.
Part 3: Digging for Root Causes with the Decomposition Tree
Smart Narrative is great at summarizing what's visible on the page. But what if you want to find the hidden drivers behind a number? For this, we turn to the Decomposition Tree. It's a powerful tool for root cause analysis that allows you to break down a metric (like Total Revenue) across various dimensions to see how they contribute.
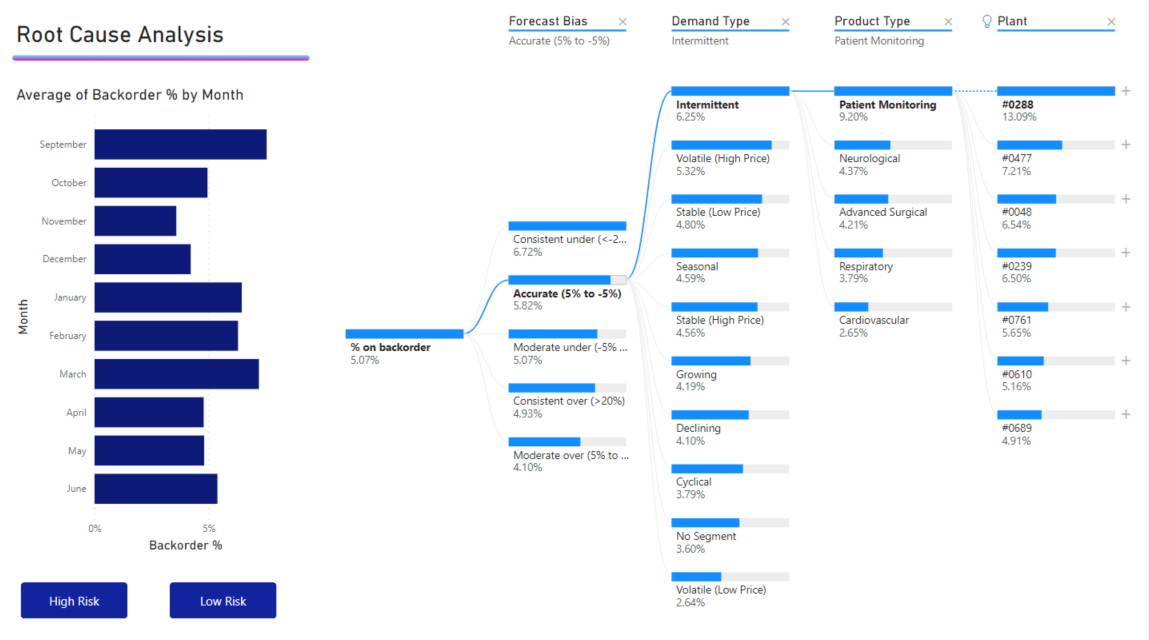
Let's see it in action.
How to Use AI in Power BI to Make Smarter Dashboard?
Let's return to Pavan Lalwani's video, which has an excellent segment on the Decomposition Tree.
Watch the segment from 09:16 to 16:37. Notice how it lets you explore different paths to understand a metric. Pay attention to the 'AI splits' feature, where Power BI suggests the most interesting dimension to drill into.
Your Turn: Find the "Why"
Let's add a Decomposition Tree to your dashboard. You can add a new page to your report to give it more space.
- On a new page in your report, add the Decomposition Tree visual from the Visualizations pane.
- In the visual's field settings, you'll see two main buckets:
- Analyze: Drag the metric you want to investigate here. Let's use
Total Revenue. - Explain by: Drag the dimensions you want to explore here. Let's add
Region,Category,Segment, andShip Mode.
- Analyze: Drag the metric you want to investigate here. Let's use
- In the visual, you'll see your total revenue and a
+sign. Click the+sign. - A dropdown menu will appear. The dimensions with a lightbulb icon are AI-suggested "high" or "low" value splits. Select one of them, or choose any dimension to start your analysis.
- Continue clicking the
+sign to drill down further and uncover the path that contributes most (or least) to your total revenue.
Test your understanding!
You've built a Decomposition Tree to analyze profit. After breaking it down by Region, you see the 'Central' region has negative profit. What is your next logical step within the visual to understand why the Central region is unprofitable?
Show answer
You would click the + sign next to the 'Central' region bar in the tree. Then, you would choose another dimension from the 'Explain by' list, such as Category or Sub-Category, to see which products are responsible for the losses within that specific region.
Part 4: A Pro Tip - The "Explain the Change" Feature
Sometimes you don't need a whole new visual; you just want a quick explanation for a single data point. Power BI's Analyze feature is perfect for this.
How to Use AI in Power BI to Make Smarter Dashboard?
The final clip from Pavan Lalwani's video showcases a feature that many users miss but is incredibly powerful for on-the-fly analysis.
Watch from 22:17 to 28:50. This demonstrates how to right-click on a data point in a chart and ask Power BI to 'Explain the decrease' or 'Explain the increase'. Note how it automatically generates several visuals to explain the change.
Your Turn: Try the Quick Analysis
- Go back to your main dashboard page with the line chart showing sales over time.
- Find a point on the chart that represents a significant increase or decrease from the previous point.
- Right-click that data point.
- Select Analyze -> Explain the decrease (or increase).
Power BI will open a window with several auto-generated charts and text explaining the key factors that contributed to that specific change. This is an incredibly fast way to generate insights that would have taken hours to find manually.
Conclusion
In this lesson, you've supercharged your dashboard with AI. You have moved from simply presenting data to interpreting it. By integrating these AI-powered visuals, you can now build a much richer, more insightful narrative for your audience of managers.
Key Takeaways for Your Workshop:
- Go Beyond 'What' to 'Why': The real value for managers lies in understanding the reasons behind the numbers.
- Smart Narrative tells the story: Use it to automatically summarize key takeaways on a dashboard, providing instant context.
- Decomposition Tree finds the cause: Use it as a powerful, interactive tool for root cause analysis.
- The Analyze feature gives quick answers: Teach it as a "pro tip" for instantly explaining changes in trend charts.
- The narrative is a combination: The ultimate story is built by combining the insights from standard charts with the deeper explanations provided by AI visuals.
Preview of the Next Lesson:
You've now learned how to clean data, build a dashboard, and enrich it with AI. In the final lesson of our capstone project, we will focus on troubleshooting common issues that arise in Power BI projects and, most importantly, identifying opportunities to apply these powerful techniques within a real-world business context, creating an action plan for data-driven decision-making.