Hello! Welcome to the next lesson in our capstone project. In the last session, you did an excellent job enriching your dashboard's narrative with powerful AI visuals like the Smart Narrative and Decomposition Tree. You've essentially built the "ideal" version of your report—what it looks like when everything goes right.
However, in the real world, things don't always go according to plan. Data sources change, users make mistakes, and reports break. This lesson is designed to prepare you for those moments. Our goal is to master the learning outcome: Troubleshoot common data and visualization issues using a checklist approach.
By the end of this lesson, you will have a systematic framework for diagnosing and fixing the most frequent problems that you—and the managers you'll be training—will encounter. This skill is critical for building confidence and ensuring your data projects are robust and reliable.
Part 1: The Troubleshooter's Mindset - A Systematic Approach
When a report breaks, it's tempting to start clicking randomly to fix it. A much more effective method is to follow a logical path, starting from the data source and moving forward to the final visual. This isolates the problem efficiently.
Most Power BI projects follow a clear data flow:
- Data Source: The original files or databases (e.g., your Excel file).
- Power Query: Where data is cleaned and transformed.
- Data Model: Where tables are related and calculations (DAX) are created.
- Report Visuals: The charts and tables in your
.pbixfile. - Power BI Service: The published dashboard in the cloud.
An error at any stage will impact all subsequent stages. Therefore, troubleshooting should happen in that order.
The following video provides an excellent overview of this structured thought process.
How to TROUBLESHOOT and FIX most common ERRORS in Power BI // Beginners Guide to Power BI in 2022
The video 'How to TROUBLESHOOT and FIX most common ERRORS in Power BI' by Fernan | Power BI starts by outlining a clear, four-part mental model for troubleshooting. This framework will be the foundation of our checklist.
Please watch from 01:08 to 02:09. Focus on the presenter's four-part process: checking the source, the transformation (Power Query), calculations (DAX), and the Power BI service. We will adapt this for our checklist.
Part 2: Solving Data Pipeline Problems in Power Query
For beginners, most frustrations start in the data pipeline. Power Query is powerful, but it relies on a consistent data source. When the source changes, queries can break. Let's look at the most common data-level issues and how to fix them.
The same video we just started provides clear demonstrations of these problems.
How to TROUBLESHOOT and FIX most common ERRORS in Power BI // Beginners Guide to Power BI in 2022
Let's continue with the video 'How to TROUBLESHOOT and FIX most common ERRORS in Power BI' to see how to solve the most frequent Power Query errors.
Please watch the following three segments: Source File Moved (02:09 - 04:21): See how to fix a refresh failure when a file's location changes. Column Name Changed (04:21 - 06:59): Understand why renaming a column in your source Excel file breaks Power Query steps and how to correct it. Cell-Level Errors (07:25 - 09:53): Learn to spot and handle errors caused by incorrect data types, like text in a number column.
Here’s a summary of the key data issues you've just seen:
- Connection Errors: Power BI can't find the source file. The fix is to edit the "Source" step in Power Query and point it to the new file location.
- Step Errors: A step in your query fails, often because a column it refers to was renamed or deleted in the source. The error message usually tells you which column is missing. You can either fix the name in the source file or edit the Power Query step (e.g., in the formula bar) to use the new name.
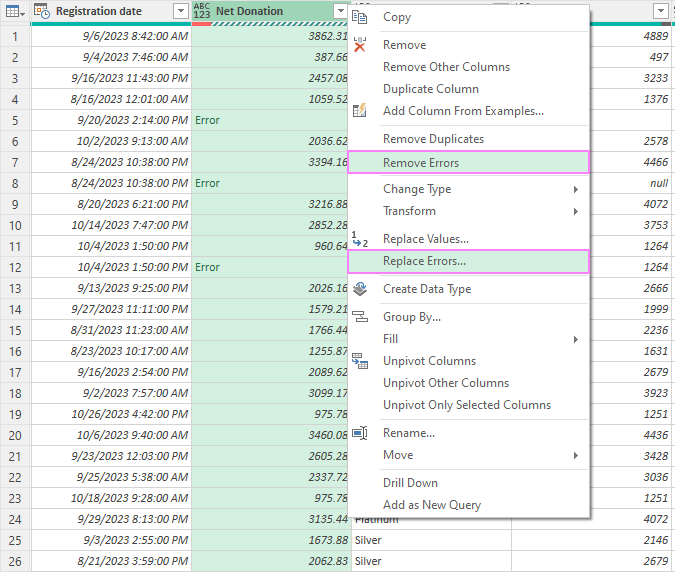
- Cell-Level Errors: A specific value cannot be converted to the correct data type (e.g., trying to format the word "apple" as a number). Power Query flags these cells.
Part 3: Solving Report and Visualization Problems
If your data refreshes successfully but your report is slow or visuals look wrong, the problem likely lies in the report itself. These issues are often related to performance or how visuals are configured.
9 Common Power BI Issues and How to Fix Them
The article '9 Common Power BI Issues and How to Fix Them' from Augmented Tech Labs provides a great text-based summary of these types of problems.
Please read the following three sections from the article: Issue 1: Slow Reports or Dashboard: Focus on the causes (large data, complex DAX, too many visuals) and the primary solution: using the Performance Analyzer. Issue 4: Visuals Not Displaying Correctly: Note the common causes like bad relationships or filter conflicts. Issue 5: Too Many Relationships Slowing Model: Understand that a simple data model (like a star schema) is faster.
Key Takeaways for Report-Level Troubleshooting:
- Slow Reports: The Performance Analyzer (found in the View tab) is your best friend. It shows you how long each visual takes to load, helping you identify the bottleneck. The most common fixes are simplifying your data model, optimizing calculations, or reducing the number of visuals on a single page.
- Visuals Displaying Incorrectly: This often happens due to:
- Bad Relationships: A relationship between two tables is set up incorrectly. The most common error is having duplicate values in the "one" side of a one-to-many relationship. The fix is to go into Power Query and remove duplicates from that key column.
- Filter/Slicer Conflicts: Multiple filters might be interacting in unexpected ways to show no data. Check the "Filters on this visual" pane to see everything that's affecting it.
Part 4: A User-Facing Checklist for Dashboards
Finally, some issues only become apparent after you publish and share a dashboard. These are often less about "errors" and more about user confusion or poor design.

The "Power BI Dashboard Checklist" from Data Goblins gives us a few excellent points to consider when troubleshooting from a user's perspective.
- Misleading "Last Refresh" Time: A common point of confusion. On a dashboard tile, the "Display last refresh time" option shows when the tile's cache was refreshed, NOT when the underlying data was. For import models, this is misleading. It's better to create a measure in your dataset that explicitly captures the data refresh time and display that in a card visual.
- Broken Tiles or Links: If a user sees a broken tile, it's often a permission issue. They may have access to the dashboard but not the underlying report or dataset. When you share, ensure users have access to all necessary components.
- Poor Layout: A cluttered or illogical layout is a "usability issue." Key metrics should be in the top-left. Less is more; avoid cramming too much onto one screen.
Part 5: Your Workshop Troubleshooting Checklist
Based on everything we've covered, here is a structured checklist you can adapt for your workshop. It guides a user from the source to the final dashboard.
The 4-Step Troubleshooting Checklist
Step 1: Check the Data Refresh
- Did the refresh fail?
- YES: Go to Power Query (
Transform data). - Check the Source: Has a file been moved, renamed, or deleted?
- Fix: In the Applied Steps, click the gear icon on the
Sourcestep and correct the file path.
- Fix: In the Applied Steps, click the gear icon on the
- Check Column Names: Has a column name changed in the source file?
- Fix: Find the first step with an error. The formula bar will likely show the old column name. Either change the name back in the source file or update the formula with the new name.
- Check for Data Type Errors: Look for
Errorvalues in your cells.- Fix: Right-click the column header and
Replace Errors(e.g., with 0 or null) orRemove Errors.
- Fix: Right-click the column header and
- YES: Go to Power Query (
Step 2: Check the Data Model & Relationships
- Does the refresh fail with a "duplicate values" error?
- YES: The error message will name a table and column. This column is being used as the "one" side of a relationship but contains duplicates.
- Fix: Go to Power Query, select that table and column, and use
Remove Duplicates.
Step 3: Check the Report Visuals (in Power BI Desktop)
- Is the report very slow?
- YES: Go to the
Viewtab and open thePerformance Analyzer. ClickStart recordingandRefresh visuals. Find the slowest visual and try to simplify it or the data it uses.
- YES: Go to the
- Is a visual blank or showing strange numbers?
- YES: Select the visual.
- Check the Filters pane. Is an unexpected filter being applied?
- Check the Relationships view. Are the tables connected correctly?
Step 4: Check the Published Dashboard (in Power BI Service)
- Is a user reporting they can't see a visual?
- YES: This is likely a permission issue. Make sure you have shared both the report/dashboard AND given them at least read access to the underlying dataset.
- Is the "last refreshed" time confusing?
- YES: Avoid the default tile refresh time. Create a measure to track data freshness and show it in a card visual on your report.
Test your understanding!
A manager you are training says their sales report suddenly shows an error after they refreshed it. They haven't touched the report itself, but they did "tidy up" the column names in their source Excel file earlier. Based on the checklist, where should you tell them to start looking for the problem?
Show answer
You should tell them to start at Step 1: Check the Data Refresh. Since the refresh is failing and they mentioned changing column names in the source, the most likely cause is a broken step in Power Query. They should open the Power Query editor and look for the first step that shows an error.
Part 6: Your Turn - Break and Fix the Capstone Project
Now, let's make this practical. You will intentionally break your capstone project and then use the checklist to fix it.
- Open your Capstone Project Power BI file.
- Break #1 (Source Error): Find the source Excel or CSV file for your project. Rename the file (e.g., from
CapstoneData.xlsxtoCapstoneData_Old.xlsx). Now, go back to Power BI and click Refresh. You should see an error.- Fix it: Use Step 1 of the checklist. Go to
Transform data, edit theSourcestep, and point it back to the newly renamed file.
- Fix it: Use Step 1 of the checklist. Go to
- Break #2 (Cell-Level Error): Open your source Excel/CSV file. Find a numeric column like 'Sales' or 'Quantity'. In one of the cells, change the number to text (e.g., type "Error here"). Save the file.
- Fix it: Refresh your data in Power BI. The refresh might succeed but with a warning. Go to
Transform data, find the column, and you should see theErrorvalue. Use theReplace Errorsfunction to fix it.
- Fix it: Refresh your data in Power BI. The refresh might succeed but with a warning. Go to
This exercise simulates the most common issues new users face and will solidify your ability to guide them through the solution.
Conclusion
Congratulations on completing this crucial lesson! You are now equipped not only to build an effective dashboard but also to diagnose and solve the common problems that will inevitably arise. This ability to troubleshoot is what separates a novice from a confident Power BI user.
Key Takeaways for Your Workshop:
- Troubleshooting is a process, not a panic. Teach your managers to follow a logical sequence from source to visual.
- The error messages are helpful. Encourage users to read the error messages, as they often point directly to the problem (e.g., "Column 'X' of the table wasn't found").
- Empower with a checklist. Providing a simple, structured checklist gives new users the confidence to solve problems independently.
Preview of the Next Lesson:
You have now mastered all the technical steps of our project, from data cleaning to AI-powered analysis and troubleshooting. In our final lesson, we will focus on the strategic application of these skills. We'll explore how to identify opportunities to apply these techniques in a real business context and guide your managers in creating a personal action plan for their own data-driven initiatives.