Hello! Welcome to the penultimate lesson of our capstone module. In the previous session, you became a Power BI troubleshooter, learning how to diagnose and fix the common issues that arise in the data pipeline and report visuals. You now have a complete technical toolkit, from cleaning data to building and maintaining a robust, AI-enriched dashboard.
This lesson pivots from the technical "how" to the strategic "why" and "where." Our goal is to master the learning outcome: Identify opportunities to apply these tools and techniques in your own work context. We will equip you with the frameworks and concepts needed to guide your workshop attendees in bridging the gap between their daily business challenges and the powerful solutions available in Power BI.
This is where the real value of your workshop will shine—by empowering managers to see their own work through a new, data-driven lens.
Part 1: Starting with the Business Question
The most effective data projects don't start with data; they start with a business problem. Before building any report, a manager should ask: "What question am I trying to answer?" or "What decision do I need to make?" The tools you've learned are the means to answer these questions.
This shift in mindset—from creating charts to solving problems—is the foundation for identifying valuable opportunities. The following video provides an excellent framework for thinking about this process.
Data Analyst on How to Turn Business Metrics to Insights
In 'Data Analyst on How to Turn Business Metrics to Insights,' Christine Jiang explains how all data analysis stems from understanding and investigating business metrics. This is a crucial concept for your managers to grasp.
Please watch the following two segments: Introduction (00:33 - 02:14): Pay attention to how stakeholder questions are always about a specific metric (e.g., conversion rate, revenue) and its movement. The goal is to find the 'why' behind the 'what.' Four-Pillar Framework (03:48 - 05:47): Focus on the four key steps: defining questions, identifying metrics, reporting/visualizing, and formulating recommendations. This is a simple but powerful process you can teach.
The key takeaway for your workshop is that every good dashboard is a response to a question. Encouraging managers to articulate their questions first will naturally lead them to the metrics and data they need.
Part 2: Finding Opportunities in Everyday Work
Managers might think that "AI" is only for large, complex projects. It's important to demystify this. As AI expert Andrew Ng explains, some of the most significant value comes from a "long tail" of smaller, customized projects that solve unique business problems.
How AI Could Empower Any Business | Andrew Ng | TED
In this TED talk, Andrew Ng uses simple examples like a pizza shop and a T-shirt company to illustrate how AI can be applied to everyday business challenges. This perspective will help managers see opportunities in their own roles.
Watch the segment from 01:38 to 06:46. Notice the argument that every business, regardless of size, generates data and has unique problems (like demand forecasting or quality control) that AI can help solve. This democratizes the idea of AI.
This concept of the "long tail" is a powerful message for your workshop. The tools you've taught—Power Query and Power BI—are exactly what enable these custom, high-value projects without needing a team of AI scientists.
Part 3: A Framework for Identifying and Prioritizing Opportunities
To make this process concrete for your managers, you need to provide them with a structured way to brainstorm and evaluate ideas. The "AI Opportunity Assessment" is a perfect tool for this. It guides users through a simple, logical process.
First, let's look at the overall process visually.

Now, let's dive into a practical template that your managers can use directly.
AI Opportunity Assessment Template
The 'AI Opportunity Assessment Template' provides a step-by-step worksheet for identifying and evaluating potential AI and automation projects. This is an excellent handout or activity for your workshop.
Please read the first three steps of the template: Step 1: Identify High-Volume, Low-Value Tasks: Review the extensive list of examples for Simple, Intermediate, and Advanced AI use cases. These are fantastic for sparking ideas across different departments (HR, Sales, Finance, etc.). Step 2: Evaluate for AI Fit: Focus on the scoring system. A task is a good candidate if it's manually repetitive, has a significant time impact, and is suitable for AI. This turns a subjective idea into a scored priority. Step 3: Prioritise Opportunities: This step considers cost and estimated time savings, which is the language of business managers.
This template transforms a vague goal ("use AI") into a concrete action: find a repetitive, time-consuming task and see if a tool can do it better.
Part 4: Connecting Opportunities to Power BI's Capabilities
Once a manager identifies a potential opportunity, the next step is to connect it to a specific tool or feature they've learned about. This is where you bring the discussion back to Power BI.
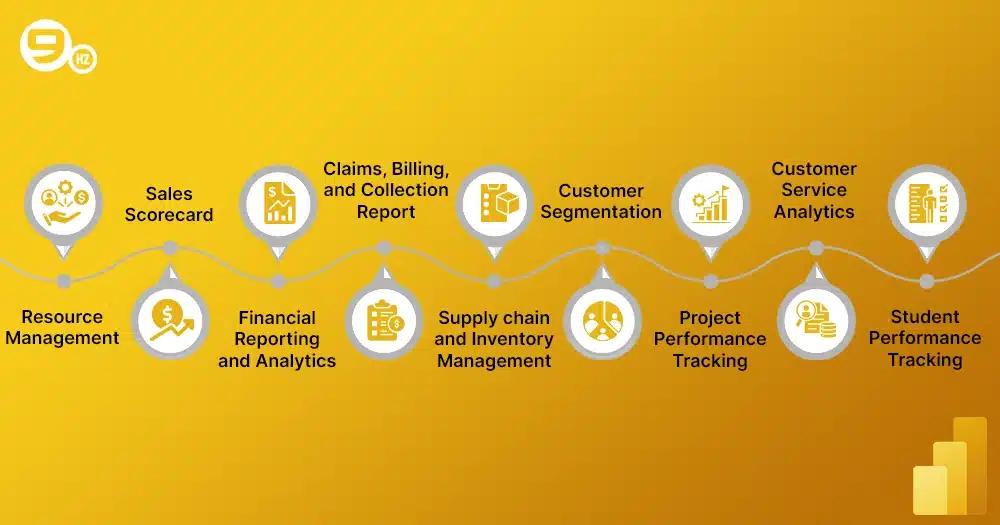
The AI features built into Power BI are specifically designed to answer the types of business questions managers have.
AI Insights in Power BI: AI at the service of decision-making!
The article 'AI Insights in Power BI' directly links Power BI's features to decision-making. It explains how the tool moves beyond just showing 'what' happened to explaining 'why'.
Read the introduction and the first two sections ('Why Inject AI into Your Power BI Reports?' and 'An Overview of Native AI Features in Power BI'). Focus on how features like 'Key Influencers' and anomaly detection directly address the need to find root causes without requiring users to be data scientists.
By connecting the dots, you can frame the tools as follows:
- Problem: "I spend hours every week manually compiling a sales report."
- Opportunity: Automate a high-volume, repetitive task.
- Power BI Solution: Use Power Query to automate the cleaning and merging of data, then create a Power BI report that refreshes with one click.
- Problem: "Our customer churn rate went up last quarter, and I don't know why."
- Opportunity: Perform a root cause analysis.
- Power BI Solution: Use the Key Influencers or Decomposition Tree visual to analyze the factors contributing to churn.
- Problem: "I need to forecast our inventory needs for the next six months."
- Opportunity: Predict future trends based on historical data.
- Power BI Solution: Use the built-in Forecasting feature on a line chart.
Test your understanding!
A manager in your workshop works in logistics. They spend 5-8 hours every week manually compiling reports on late shipments to find out which carriers are most often delayed. Using the framework from the 'AI Opportunity Assessment Template,' how would you classify this opportunity, and what Power BI feature could you suggest?
Show answer
- Classification: This is a strong candidate for automation. Using the template's scoring system, it would score high on Manual Repetition (5/5) and Time Impact (4/5 or 5/5). It is also highly suitable for AI/automation (5/5). The total score would be 14 or 15, making it a top priority.
- Power BI Suggestion: This is a root cause analysis problem. You could suggest using the Key Influencers visual to automatically analyze which factors (e.g., carrier, route, warehouse, day of the week) contribute most to shipments being late. A simple bar chart showing delays by carrier would also be a great starting point.
Part 5: Your Workshop Activity: The Opportunity Brainstorm
As the instructor, your role is to facilitate this discovery process. Here is a plan for a 30-45 minute activity you can run during your workshop:
- Introduce the Goal (5 mins): Explain that the objective is to find one or two real-world tasks in their own jobs that could be improved with data analysis or automation.
- Individual Brainstorming (10 mins):
- Distribute a simplified version of the "AI Opportunity Assessment Template".
- Ask each manager to silently list 3-5 tasks they do regularly that are repetitive, time-consuming, or based on guesswork.
- Have them use the scoring system (Manual Repetition + Time Impact + AI Suitability) to rank their own ideas.
- Small Group Discussion (15 mins):
- In groups of 3-4, have each person share their highest-scoring opportunity.
- The group's task is to help each other refine the idea by asking:
- "What business question are you trying to answer?"
- "What metric would help you measure this?" (e.g., "late shipment rate," "employee turnover")
- "Which Power BI visual or feature we've learned might help?" (e.g., a line chart for trends, a map for geographic data, Key Influencers for root cause).
- Group Share-Out (5-10 mins):
- Ask each group to share one compelling example with the room. This reinforces the concepts and shows the variety of applications.
Conclusion
You have now journeyed from the raw, messy beginnings of data to the strategic identification of business opportunities. This lesson provides the crucial link between the technical skills your managers have learned and the real-world value they can create.
Key Takeaways:
- Effective data analysis starts with a business question, not a tool.
- Valuable opportunities often lie in automating high-volume, repetitive tasks that managers perform every day.
- A simple framework (Identify, Evaluate, Prioritize) can help managers systematically find and vet potential projects.
- The AI features in Power BI are built to answer common business questions about root causes, trends, and key drivers.
Preview of the Next and Final Lesson:
With a list of potential opportunities in hand, the final step is to turn ideas into action. In our last lesson, we will focus on the final outcome of the capstone project: Create a personal action plan for implementing data-driven decision-making. You will learn how to guide your managers in selecting one opportunity and outlining the concrete steps needed to make it a reality.