Hello! Welcome to your next lesson on AI-Powered Analytics in Power BI.
In our last session, we explored the 'Quick Insights' feature. You learned how to teach managers to use it as an automated data exploration tool, perfect for uncovering unexpected patterns when you don't have a specific question in mind. It's the AI equivalent of asking, "What's interesting in this data?"
Now, we move from broad exploration to focused investigation. This lesson addresses the learning outcome: Apply the 'Key Influencers' visual to identify factors affecting a metric. We'll delve into a powerful AI visual that helps answer specific business questions like, "What are the main drivers of low customer satisfaction?" or "What factors lead to an increase in sales?" For the managers in your workshop, this tool bridges the gap between seeing a problem and understanding its root causes.
Part 1: What is the Key Influencers Visual?
The Key Influencers visual is an AI-powered tool that analyzes your data to find and rank the individual factors that have the most significant impact on a particular metric. Unlike Quick Insights, which looks for general patterns, this visual is designed for targeted analysis.
To start, let's get a formal definition and see it in action.
Power BI Key influencers visual
This short introduction from the official Microsoft Power BI channel explains what the Key Influencers visual is and its purpose as an AI-driven tool for analysis.
Watch the first 21 seconds of the video to get a concise overview of the visual's function.
As the video explains, the visual runs intelligence "behind the scenes" to surface insights. For your workshop, you can frame it as a tool that helps managers move beyond what is happening to why it's happening.
Part 2: Setting Up and Configuring the Visual
The power of the Key Influencers visual lies in its simple setup, but it's crucial to get it right. The visual has two main fields in the Visualizations pane:
- Analyze: This is for the metric you want to understand (e.g., 'Customer Rating', 'Sales Amount', 'Employee Churn').
- Explain by: This is where you add all the potential factors you think might influence your metric (e.g., 'Country', 'Product Category', 'Subscription Type').
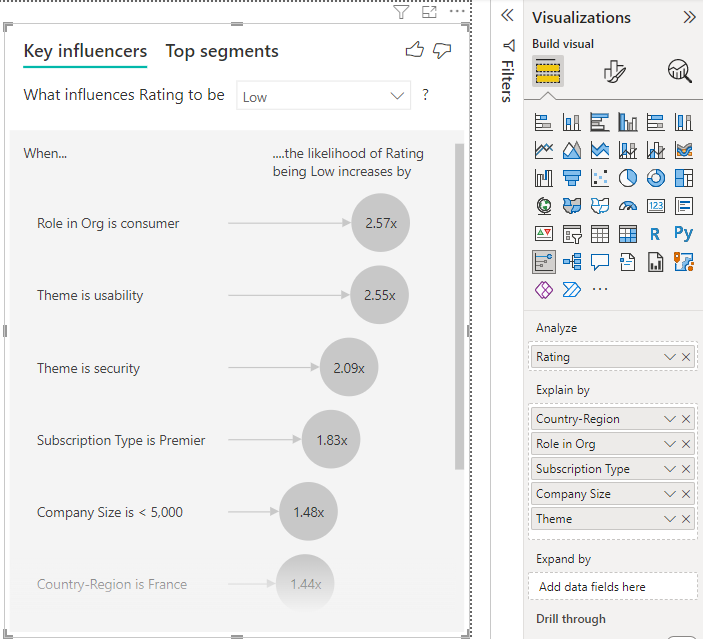
Now, let's walk through the process of setting this up. The following Microsoft Learn article provides a clear, step-by-step guide.
Key Influencers Visualizations Tutorial - Power BI
The official Microsoft Learn article 'Key Influencers Visualizations Tutorial' is an excellent resource. We'll use it to understand the setup process.
Please read the section titled 'Analyze a metric that is categorical'. Follow the five steps listed to see how to add the visual and populate the 'Analyze' and 'Explain by' fields. This is the core workflow you'll teach in your workshop.
A common mistake for beginners is to confuse the Analyze and Explain by fields. The blog post "10x Faster Data Exploration With Power BI Key Influencer" highlights this exact issue and how to correct it. Pointing out this potential pitfall in your workshop can save your managers a lot of confusion.
Part 3: Interpreting Key Influencers
Once configured, the visual presents its findings in two main tabs: Key influencers and Top segments. Let's start with the first tab.
Analyzing Individual Factors
This view shows a ranked list of the single most impactful factors.
- For Categorical Metrics (e.g., Rating is 'Low'): The visual tells you how much more likely a certain outcome is when a factor is present. For example, "When Role in Org is consumer, the rating is 2.57x more likely to be Low."
- For Continuous Metrics (e.g., Tenure): It explains how an increase or decrease in a numeric factor impacts the outcome. For example, "When Tenure increases by 13 months, the likelihood of a low rating increases by 1.23x."
The following video provides an excellent walkthrough of interpreting both categorical and continuous influencers.
Power BI Key influencers visual
Let's return to the Microsoft Power BI video to see how to interpret the results for different types of influencing factors.
Please watch the following segments: 00:21 - 01:31: Setting up the visual with categorical factors. 01:31 - 03:55: Interpreting the results for categorical factors, including the likelihood multiplier and the bar chart comparison. 04:35 - 05:21: Interpreting a continuous factor ('Tenure'). Pay close attention to how the narrator explains the meaning of the 'x times more likely' statement and the average line.
It's important to teach your managers that the AI is doing more than just picking the category with the highest or lowest value. As explained in the blog post by Tobias Zwingmann, the algorithm considers the overall trend and impact, not just a single data point. This is a sign of a more sophisticated analysis.
Analyzing Numeric Metrics
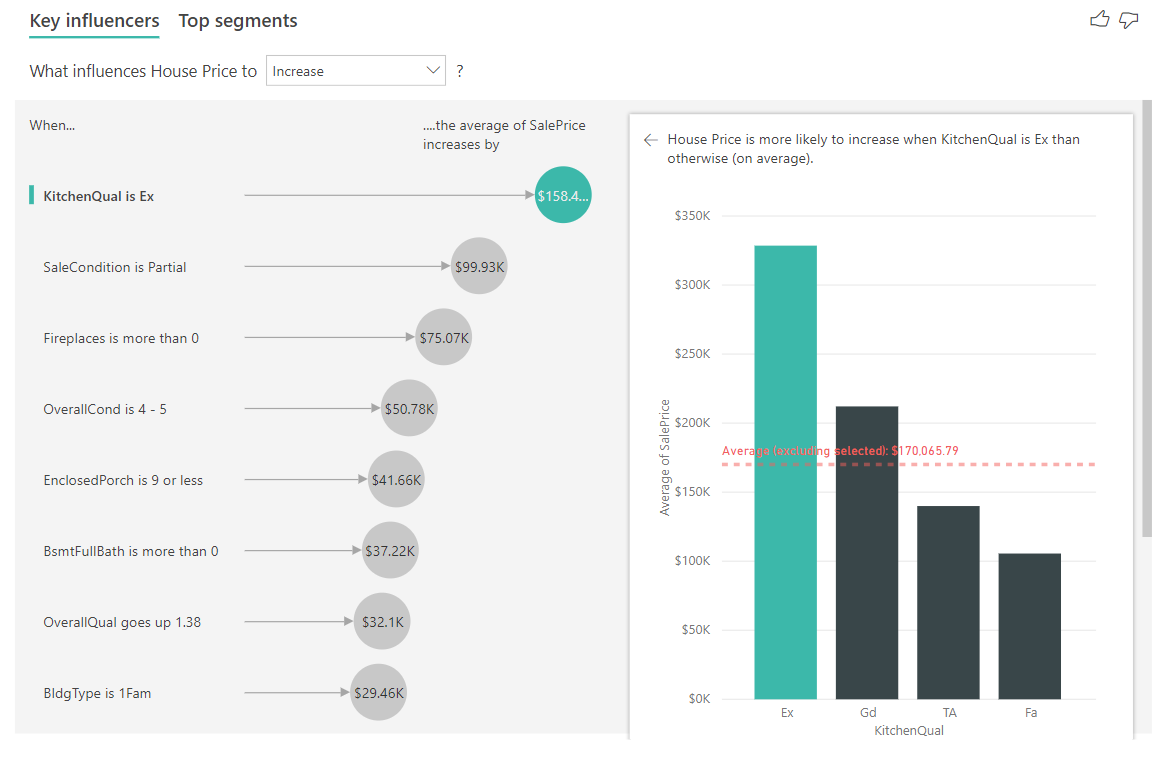
You can also analyze a numeric metric directly, such as "What influences House Price to increase?" In this case, the interpretation changes slightly. Instead of likelihood, the visual quantifies the impact in the unit of the metric (e.g., dollars).
Test your understanding!
A manager in your workshop is analyzing what drives high employee attrition ('Yes'). The Key Influencers visual returns the top factor: "When Commute Distance is > 20 miles, the likelihood of attrition increases by 3.1x."
The manager asks you, "Does this mean that commute distance is the only thing we should focus on?" How would you answer?
Show answer
You would coach them that this is the top single factor identified by the AI, but it's not the whole story. A good response would be:
"That's a great insight! It tells us that long commutes are a major driver of attrition on their own. However, this is just the first piece of the puzzle. The next step is to look at the other influencers on the list to see what else contributes. Even better, we can switch to the 'Top Segments' tab to see how commute distance might combine with other factors, like job role or salary level, to create even higher-risk groups of employees. The AI gives us the clues, and we use our business knowledge to put them together."
Part 4: Identifying High-Impact Segments
While individual factors are insightful, the real power often comes from understanding how they combine. This is the purpose of the Top segments tab. It performs a cluster analysis to find groups of the population with a significantly higher-than-average incidence of the outcome you're analyzing.
Each bubble on the chart represents a segment:
- The height of the bubble shows the percentage of the outcome within that segment.
- The size of the bubble represents the population size of that segment.
This allows managers to identify and prioritize which groups to focus on. A small, high-risk segment might be interesting, but a large, moderately high-risk segment might be a better target for intervention because it affects more people.
Power BI Key influencers visual
The Microsoft video also provides a clear explanation of the 'Top segments' tab.
Watch the segment from 07:30 to 09:01. The presenter explains how to read the segment bubble chart and how to click into a segment to understand its definition (e.g., customers who are not publishers, have 4+ support tickets, and have been customers for over 29 months).
Part 5: Troubleshooting and Limitations
As a workshop facilitator, you will inevitably be asked why the visual isn't working as expected. Being prepared for common issues is key. The official documentation has an excellent troubleshooting section.
Key Influencers Visualizations Tutorial - Power BI
To prepare you for your workshop, this final reading covers the common issues managers may face when using the Key Influencers visual.
Please read the section 'Considerations and troubleshooting'. Pay special attention to the explanations for the following common errors: 'No influencers or segments were found.' 'The metric I'm analyzing doesn't have enough data...' The error related to a field not being 'uniquely related' to the metric's table (one-to-many relationships).
Understanding these limitations—especially the need for sufficient data and properly structured relationships—will enable you to confidently guide your workshop participants through any technical hurdles.
Conclusion
You are now prepared to teach managers how to perform targeted root cause analysis using the Key Influencers visual. This powerful feature empowers them to move from observation to understanding by pinpointing the specific factors that drive key business outcomes.
Key Takeaways for Your Workshop:
- The Key Influencers visual is for focused investigation to answer "What drives metric X?"
- Proper setup is crucial: place the outcome in Analyze and potential causes in Explain by.
- Interpret individual influencers by their likelihood multiplier (e.g., 2.57x) or direct impact (e.g., +$158K).
- Use the Top segments tab to find high-impact combinations of factors, which are often more actionable.
- Be aware of common issues, such as needing enough data and having correctly defined data relationships.
Preview of the Next Lesson:
The Key Influencers visual automatically finds the most statistically significant factors for you. But what if you want to explore a specific hypothesis or manually drill down into the components of a metric? In the next lesson, we will cover the 'Decomposition Tree'. This visual allows you to interactively break down a metric across multiple dimensions, giving you full control over the root cause analysis process.