Hello! Welcome to the next lesson in our module on AI-Powered Analytics in Power BI.
In our previous session, you learned how to teach managers to use the 'Key Influencers' visual. That tool is fantastic for when you want Power BI's AI to automatically analyze all potential factors and tell you which ones are the most statistically significant drivers of an outcome. It answers the question, "What should I be paying attention to?"
Today, we shift from AI-driven discovery to AI-assisted exploration. We will tackle the learning outcome: Create a 'Decomposition Tree' visual to set up a root cause analysis. This visual puts the user in the driver's seat, allowing them to break down a metric and explore different paths, either manually or with help from AI. It's a powerful tool for conducting a structured root cause analysis (RCA) and is often a favorite among business analysts.
The "Five Whys" and the Decomposition Tree
Before we dive into Power BI, let's connect this to a familiar business concept: the "Five Whys" method. This is a simple but powerful technique for RCA where you repeatedly ask "Why?" to trace a problem back to its origin. The Decomposition Tree is essentially a visual and interactive version of this method.
The article "Using the Power BI Decomposition Tree for Root-Cause Analysis" explains this connection well. It frames the visual as a tool that lets you drill down through your data, asking "Why?" at each level to uncover the factors contributing to a key performance indicator (KPI). This is an excellent way to introduce the visual to the managers in your workshop.
Part 1: Setting Up the Decomposition Tree
Like the Key Influencers visual, the Decomposition Tree is simple to configure but requires you to understand its two primary fields:
- Analyze: This is where you place the single metric or KPI you want to break down (e.g., Total Sales, CSAT Score, % of Backorders).
- Explain by: This is where you add all the different dimensions or categories you want to use to break down your metric (e.g., Country, Product, Department, Manager).
Let's see what a completed Decomposition Tree looks like. This visual is analyzing the root causes of product backorders.
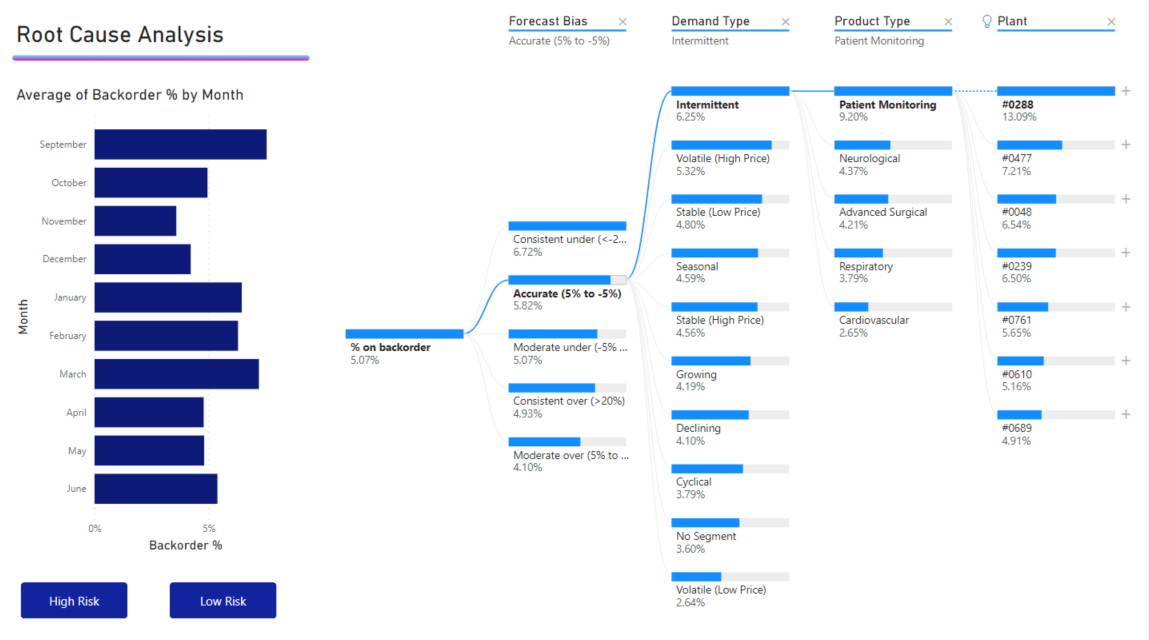
Now, let's get hands-on and build one. The best way to learn is by doing. We'll follow a tutorial from Microsoft that uses a pre-built sample file, which is a great approach to use in your workshop.
Tutorial: Create a decomposition tree with a Power BI sample
The official Microsoft tutorial 'Create a decomposition tree with a Power BI sample' provides an excellent step-by-step guide. We'll use this to build our first tree.
Please follow these steps: Read the 'Prerequisites' and 'Open the sample in Power BI Desktop' sections to download and open the 'Retail Analysis Sample .pbix' file. Follow the instructions in the 'Create a decomposition tree' section. This will guide you through adding the visual, populating the 'Analyze' field with 'This Year Sales', and adding several dimensions to the 'Explain by' field. Stop before the 'Analyze in the decomposition tree' section.
After completing these steps, you will have a blank Decomposition Tree visual that is correctly configured and ready for analysis. You'll see the total for "This Year Sales" with a + icon next to it. This + icon is the starting point for our entire analysis.
Part 2: Two Ways to Explore the Tree
Once the visual is set up, you can start breaking down your metric. There are two primary ways to do this, and you should teach both methods to your workshop participants so they understand the flexibility of the tool.
- Manual Exploration: The user decides which dimension to investigate at each step.
- AI-Assisted Exploration: The user asks Power BI to find the dimension that explains the highest or lowest value at each step.
The following video provides an excellent demonstration of setting up the tree and using both exploration methods.
Power Bi - Decomposition Tree | Efficiency 365
This video from 'Efficiency 365' walks through creating a Decomposition Tree from scratch and clearly demonstrates both manual and AI-assisted exploration.
Please watch the following segments: 00:00 - 01:31: This covers adding the visual and the data, reinforcing what you just did in the hands-on exercise. 01:31 - 03:00: This part shows manual exploration. Notice how the presenter clicks the '+' sign and chooses dimensions like 'Segment' to break down the sales data. 05:42 - 07:10: This crucial segment shows AI-assisted exploration. Pay close attention to how selecting 'High value' lets Power BI automatically choose the dimension that contributes most to the sales total at each level. The lightbulb icon indicates an AI-driven choice.
Understanding these two modes is key. Manual exploration is perfect for testing a specific hypothesis (e.g., "I think the problem is in the 'Government' segment, let me check"). AI-assisted exploration is for when you want the data to guide you to the most significant factors, high or low.
Test your understanding!
A manager in your workshop wants to find the root cause of a drop in customer satisfaction. They have a hypothesis that the 'West' region is the primary problem area. Which exploration method should they use first, and why?
Show answer
They should start with manual exploration. Since they have a specific hypothesis (the 'West' region), they can click the + sign and manually select 'Region' from the 'Explain by' list to immediately test their theory. If they were to use the AI-assisted 'Low value' option first, Power BI might identify a different dimension (like 'Product Category') as the biggest driver, which wouldn't directly answer their initial question.
Part 3: Practical Tips for Your Workshop
As a facilitator, it's valuable to provide practical tips that make tools easier to use for a non-technical audience. Here are two tips you can share about the Decomposition Tree.
Tip 1: Guide Your Users by Naming and Ordering Fields
The order of dimensions in the Explain by bucket determines the order they appear in the dropdown menu. You can also rename them for clarity. This helps guide your managers toward the most relevant factors.
Use the Power BI Decomposition Tree to Explore and Analyze Your Data
In this video, Avi Singh from PowerBIPro offers some excellent practical advice on making the Decomposition Tree more user-friendly.
Watch the segment from 04:35 to 06:35. Notice how he explains that ordering the fields in 'Explain by' provides guidance and how renaming a field like 'Color' to 'Product Color' adds clarity for the end-user.
Tip 2: Lock Key Levels for a Consistent Analysis
Sometimes you may want to ensure that the analysis always flows through a specific dimension. The lock feature allows you to fix a level in the tree. Once a level is locked, other users viewing the report can't remove it, which is useful for creating a standardized RCA path. You can see this feature demonstrated in the "Efficiency 365" video at timestamp 08:39.
Conclusion
You are now equipped to teach your workshop participants how to set up the Decomposition Tree for root cause analysis. This visual is a bridge between data and business intuition, allowing managers to explore their data in a structured, hierarchical way.
Key Takeaways for Your Workshop:
- The Decomposition Tree is a visual tool for Root Cause Analysis, much like the "Five Whys" method.
- Setup is straightforward: put the main KPI in the Analyze field and the explanatory dimensions in the Explain by field.
- Users have two ways to explore: manually choosing a path to test a hypothesis or using the AI-assisted 'High/Low value' options to be guided by the data.
- Small tweaks, like ordering and renaming fields, can greatly improve the user experience for non-technical managers.
Preview of the Next Lesson:
We have successfully set up the visual and initiated the analysis. But what does the completed tree actually tell us? In our next lesson, we will focus on the final step: Interpret the results of a 'Decomposition Tree' to explain factors contributing to a business metric. You will learn how to read the visual's path to construct a clear narrative about the root causes of a business outcome.