Hello! Welcome to the first lesson of our module on AI-Powered Analytics in Power BI.
In our previous module, you learned how to design and build a polished, professional-looking report. You now have the skills to teach managers how to arrange visuals into a clear, logical layout that tells a compelling story with data. But what if you're not sure which story to tell? What if you suspect there are important patterns hidden in the data that you haven't even thought to look for?
This is where AI can be a powerful partner. This lesson addresses the learning outcome: Use the 'Quick Insights' feature to automatically discover patterns in data. We'll explore how this feature acts as an automated data analyst, scanning your dataset to uncover correlations, trends, and outliers in seconds. This is a fantastic feature to introduce to managers, as it provides immediate value with a single click.
Part 1: What is Quick Insights?
For your workshop, it's best to introduce Quick Insights as a "data assistant." It's a feature that helps jumpstart the analysis process by automatically searching for interesting patterns. It answers the question, "I have this data... where should I even start looking?"
Quick Insights works by running a set of advanced algorithms on your data, which Power BI developed in partnership with Microsoft Research. It looks for things like:
- Significant correlations between different metrics.
- Unexpected spikes or dips in a time series.
- Data points that are statistical outliers.
- Overall trends and seasonal patterns.
To give your managers a better understanding of what Power BI is looking for, you can refer them to the official documentation on the types of insights it generates.
The Microsoft Learn article 'Get Power BI Insights' provides a clear, non-technical overview of the different analytical patterns Quick Insights can find. Understanding these will help your managers make sense of the results.
Please read the sections titled 'What insights reveal', 'Common terms', and 'Types of insights Power BI finds'. As you read, think about which of these insight types (e.g., 'Top and bottom performers', 'Seasonal patterns', 'Unusual values') would be most compelling for managers in an industrial setting.
The key takeaway for your audience is that Quick Insights automates the tedious work of initial data exploration, freeing them up to focus on what the patterns actually mean for the business.
Part 2: How to Generate Quick Insights
Now for the practical part. One important detail to emphasize in your workshop is that Quick Insights is a feature of the Power BI service (the online version), not Power BI Desktop. This means the report must first be published to the cloud.
The process is straightforward. Let's walk through it step-by-step.
- Publish the Report: From Power BI Desktop, save your report and then use the Publish button on the Home ribbon to upload it to a workspace in the Power BI service.
- Navigate to the Semantic Model: In the Power BI service, go to the workspace where you published your report. You will see both the report and its corresponding semantic model (formerly called a dataset).
- Run Quick Insights: Hover over the semantic model, click the More options (...) menu, and select Get quick insights.

Power BI will then take a few moments to analyze the data. Once it's done, you'll get a notification and can click to View insights.
To see this entire workflow in action, the following video provides a concise demonstration.
How to Use AI in Power BI to Make Smarter Dashboard?
The video 'How to Use AI in Power BI to Make Smarter Dashboard?' from Pavan Lalwani provides a great walkthrough of publishing a report and running Quick Insights.
Watch the segment from 00:31 to 00:33:13. The presenter clearly explains the prerequisite of publishing the report and then demonstrates how to trigger the Quick Insights feature from the Power BI service.
Part 3: Interpreting and Using the Insights
After the analysis is complete, Power BI presents the findings on a special canvas containing up to 32 "insight cards." Each card displays a chart and a brief description of the finding.
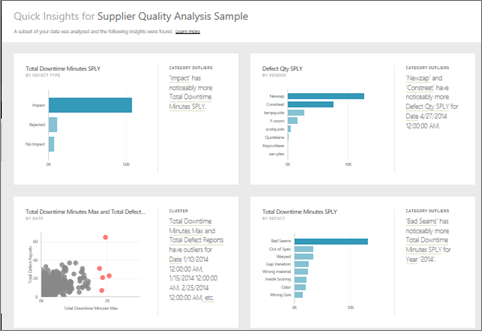
The crucial skill to teach here is critical evaluation. Not every insight will be useful. For example, the video presenter noted that an insight correlating "Postal Code by Category" was not meaningful. This is where a manager's domain expertise is essential to separate the signal from the noise.
Once a manager finds a genuinely useful insight, they can add it to a dashboard to share with others.
How to Use AI in Power BI to Make Smarter Dashboard?
Let's return to the same video to see how to interact with the insight cards and pin them to a dashboard.
Watch the segment from 00:33:13 to 00:37:13. Pay attention to how you can: Review the different insight cards generated by the AI. Hover over a useful visual and click the Pin visual icon. Add the visual to a new or existing dashboard.
This ability to quickly find a valuable pattern and pin it to a dashboard is the core workflow you'll want your managers to master.
Test your understanding!
Imagine a manager at a manufacturing plant runs Quick Insights on their production data. One of the insight cards says, "Defect Qty shows a seasonal pattern, peaking on Mondays."
As the workshop facilitator, how would you coach the manager to interpret and act on this insight?
Show answer
You would encourage them to use this AI-generated insight as a starting point for human-led investigation. Good coaching questions would be:
- Validation: "Does this pattern make sense based on what you know about our operations? Do we have more staff turnover or less experienced teams working on Mondays?"
- Next Steps: "What other data could we look at to understand this? Should we filter the defect data by production line, shift, or material type to see if the pattern is stronger in a specific area?"
- Action: "If this is a real issue, what process change could we test to address it? Perhaps a pre-shift briefing on Mondays to review quality standards?"
The goal is to teach them that the insight isn't the final answer; it's the question that starts a valuable business conversation.
Part 4: Important Considerations and Limitations
To ensure your managers use this tool responsibly, it's vital to cover its limitations.
-
Works on a Subset of Data: For very large datasets, Power BI may analyze a representative sample of the data, not the entire dataset. This is usually fine for identifying broad trends but could miss rare anomalies. You should always be transparent about this possibility.
-
Not for all Data Types: As noted in the Microsoft documentation (LINK), Quick Insights does not work with all data connection types. It works best with data imported into Power BI. It won't work for data connected via DirectQuery or for real-time streaming datasets.
-
Statistical Significance is Required: If the data is too small or lacks meaningful variation, Quick Insights may not find anything. If it returns no results, it often means the data itself is uniform, not that the feature is broken.
The video you watched earlier provides an excellent summary of the "subset of data" concern.
How to Use AI in Power BI to Make Smarter Dashboard?
Let's revisit the video for a final, important warning about the reliability of Quick Insights.
Watch the concluding segment from 00:37:13 to 00:38:39. The presenter highlights the message 'a subset of your data was analyzed' and discusses the implications. This is a crucial piece of context to provide in your workshop.
Conclusion
You are now equipped to teach managers how to leverage one of Power BI's most accessible AI features. Quick Insights empowers them to move beyond static reports and begin a dialogue with their data, uncovering hidden opportunities and risks with minimal effort.
Key Takeaways for Your Workshop:
- Quick Insights is an automated data analyst that finds patterns like trends, correlations, and outliers for you.
- It's a Power BI service feature, requiring you to publish your report first.
- The workflow is simple: Publish > Navigate to Semantic Model > Get quick insights.
- Critically evaluate the results; use domain knowledge to identify which insights are truly valuable.
- Pin useful visuals to a dashboard to share discoveries and monitor them over time.
- Be aware of the limitations, especially that it may run on a subset of large datasets.
Preview of the Next Lesson:
Quick Insights is excellent for broad, undirected exploration. But what if you have a specific question, like "What are the main reasons our customer churn rate is so high?" In the next lesson, we will explore the 'Key Influencers' visual. This powerful AI tool helps you perform targeted root cause analysis by identifying and ranking the factors that have the biggest impact on a specific business metric.