Hello! Welcome to the final lesson in our module on designing clear and impactful visuals.
In the previous lessons, we focused on making individual charts and graphs as effective as possible—choosing the right chart type, adding clear labels, and applying consistent color schemes. You're now equipped to teach managers how to make every single visual count. But a report is more than just a collection of charts; it's a story told through data. The way those charts are arranged on the page determines how that story is read and understood.
This lesson addresses the learning outcome: Arrange visuals into a logical and easy-to-read dashboard layout. We will explore the principles of visual hierarchy and then dive into the practical Power BI techniques you can teach to create clean, professional, and intuitive report layouts.
Part 1: The Principles of a Logical Layout
Before we open Power BI, it's crucial to understand why layout matters. A well-structured dashboard guides the user's eye naturally to the most important information first, then to the supporting details. A poor layout feels chaotic and forces the user to work hard to find what matters.
For your workshop, you can explain that we're leveraging how people naturally read screens to make our reports more effective.
7 Best Practices for Effective Power BI Dashboard Design
To grasp these core principles, let's start with the article '7 Best Practices for Effective Power BI Dashboard Design' from Polestar Analytics. It provides a simple, powerful blueprint for dashboard structure.
Read the section titled 'How should you structure data and layout to make Power BI dashboards intuitive and useful?'. Focus on the blueprint provided, which is based on common reading patterns (like a 'Z' or 'F' shape across the screen). Internalize this hierarchy so you can teach it as a fundamental rule: Top-left: Key metrics (KPIs like total sales, profit). Middle: Breakdowns and trends that explain the KPIs. Bottom: Granular data, like detailed tables.
This structure is sometimes called the "inverted pyramid" model: the most critical, summarized information is at the top, and the level of detail increases as you move down the page.
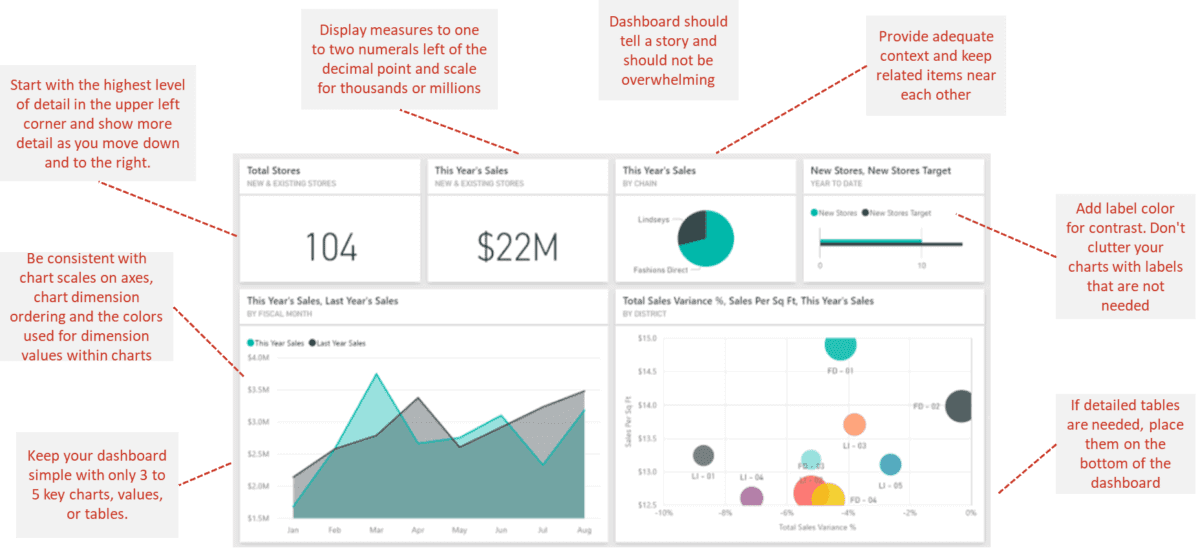
Another key principle mentioned in the article is the use of whitespace. A common mistake beginners make is trying to cram too much onto one page. Remind your managers that space between visuals is not wasted space; it helps reduce clutter, group related items, and improve overall readability.
Part 2: Practical Layout Techniques in Power BI
Now, let's translate these principles into action within Power BI. These are the practical, repeatable skills you can teach your managers.
Technique 1: Align, Distribute, and Lock
Nothing says "unprofessional" faster than misaligned visuals. Manually dragging visuals until the red guide-lines appear works, but there's a much faster and more precise way.
10 Power BI Tips for Better Dashboards | Are you using these in your Power BI reports?
The video '10 Power BI Tips for Better Dashboards' by Leila Gharani offers a fantastic demonstration of Power BI's built-in alignment tools.
Watch the following two clips: Aligning Objects (01:37 - 02:47): Pay close attention to how you can select multiple visuals (using Ctrl+Click or by dragging a selection box) and then use the Format > Align menu to align them perfectly (e.g., 'Align Top') and distribute them evenly ('Distribute Horizontally'). Lock Objects (11:15 - 11:50): After arranging everything perfectly, watch how to use View > Lock Objects to prevent visuals from being moved by accident. This is a crucial final step.
These two features—Align/Distribute and Lock Objects—are simple to learn and have a huge impact on the final quality of a report.
Test your understanding!
A manager has placed four KPI cards across the top of their report, but they are slightly uneven and have inconsistent gaps between them. What are the three steps you would tell them to take in Power BI to fix this?
Show answer
- Select all four KPI cards by holding down the
Ctrlkey and clicking on each one. - Go to the Format tab, click Align, and select Align Top. This will snap them all to the same horizontal line.
- With the cards still selected, go back to Align and select Distribute Horizontally. This will create equal spacing between each card.
Technique 2: Creating a Structured Layout with a Custom Background
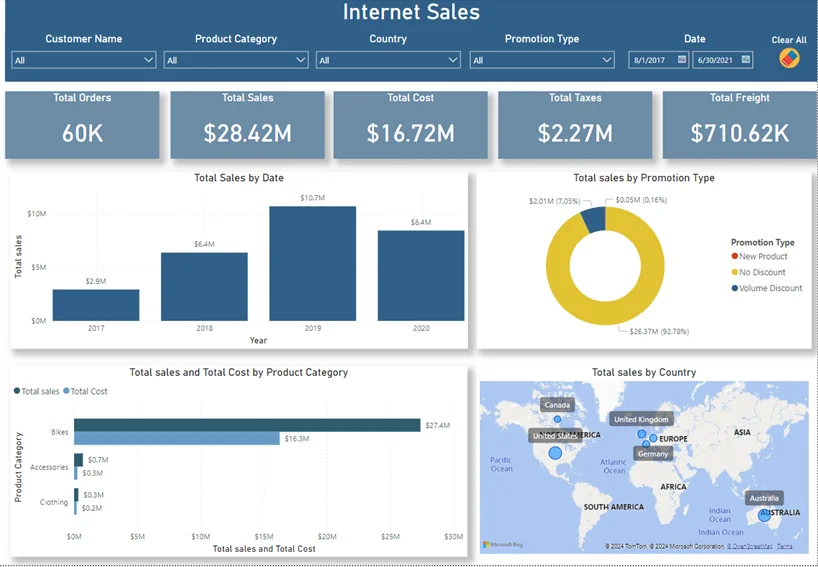
A powerful way to ensure a consistent, professional layout is to create a design "template" outside of Power BI and use it as a page background. Your managers are likely familiar with PowerPoint, making it the perfect tool for this.
The idea is to design a background image that has designated "placeholders" for your visuals. This helps define the grid, manage whitespace, and can incorporate brand colors or logos.
5 DESIGN TRICKS that Make EVERY Power BI Report Look GREAT!
Let's watch a video from 'How to Power BI' that demonstrates this advanced technique. While it shows a complex design, the core concept is what's important for you to teach.
Watch the section from 13:38 to 19:49. Don't worry about recreating the exact fancy design. Instead, focus on the workflow you can teach: Design in PowerPoint (13:38 - 17:50): The creator uses simple shapes in PowerPoint to define where the charts, KPIs, and titles will go. This creates the entire report structure. Save as an Image: The slide is saved as an image file (PNG or SVG). Apply in Power BI (17:50 - 19:49): In the 'Format your report page' pane, the image is added as a 'Canvas background'. Transparency is set to 0% and 'Image fit' is set to 'Fit'. Adjust Visuals: For each visual placed over a placeholder, the background is turned off in its formatting options so it blends seamlessly with the custom layout.
This technique separates the layout structure from the data visuals, allowing managers to create stunning, well-organized reports very efficiently once a template is made.
Part 3: Enhancing Navigation
A good layout isn't just about a single page; it's also about how the user moves between pages. Power BI has built-in features to make this easy.
10 Power BI Tips for Better Dashboards | Are you using these in your Power BI reports?
Let's return to Leila Gharani's video to see how to add simple, effective navigation.
Watch the clips on the Page Navigator (09:41 - 10:49) and the Back Button (10:42 - 11:23). These buttons can be added from the Insert > Buttons menu and automatically handle the navigation, creating a website-like experience for the report user.
Teaching managers to add a simple page navigator and back buttons can transform a set of disconnected report pages into a cohesive and user-friendly application.
Conclusion
You are now ready to teach the final and perhaps most crucial aspect of visual design: arranging all the elements into a coherent whole. By combining strategic principles with practical Power BI tools, you can empower managers to build dashboards that are not only beautiful but also highly functional.
Key Takeaways for Your Workshop:
- Structure Tells a Story: Arrange visuals logically based on reading patterns (Z-pattern). Place KPIs at the top-left, followed by trends and details.
- Use Alignment Tools: Teach the
AlignandDistributefunctions for a crisp, professional look. - Embrace Whitespace: A less-cluttered report is easier to read.
- Use Background Templates: Designing a layout in PowerPoint and importing it as a background is a powerful technique for creating polished, structured reports.
- Lock and Navigate: Always
Lock Objectsto protect the final layout and use navigation buttons to create a smooth user experience across pages.
Preview of the Next Lesson:
With our report fully designed and laid out, it's time to explore the "AI" in Power BI. In the next module, we'll dive into AI-Powered Analytics. Our first lesson will focus on using the 'Quick Insights' feature to have Power BI automatically analyze your dataset and uncover hidden patterns and correlations you might have missed.