Hello! Welcome back.
In our last lesson, we established a solid framework for choosing the right visual to answer a specific business question. We learned to start with the question, not the chart, and covered the primary uses for core visuals like bar, line, and pie charts.
Now, we'll take a deep dive into two visual types that are especially powerful for managers: maps and Key Performance Indicator (KPI) cards. These visuals excel at providing high-level, at-a-glance insights, which is exactly what a busy manager needs. This lesson directly addresses the learning outcome: Build maps to visualize geographic data and KPI cards for performance monitoring. By the end, you'll be equipped to teach your workshop participants how to create these impactful visuals in Power BI.
Part 1: Visualizing Geographic Data with Maps
Maps are incredibly effective because they transform abstract lists of locations—cities, states, postcodes—into an immediate, intuitive visual story. They help answer questions like, "Where are our highest-value customers located?" or "Which sales regions are meeting their targets?"
The First Crucial Step: Data Categorization
Before Power BI can plot your data on a map, it needs to understand that a column contains geographic information. This is the most common point of failure for beginners, so it's a critical point to emphasize in your workshop.
The video below explains this essential setup step clearly.
Power BI MAP Visualization: Must-Know PBI MasterClass!!!
This video from Power BI Bro, 'Power BI MAP Visualization', starts by explaining the most critical step for any map visual: setting the data category for your location columns. Getting this right ensures Power BI's mapping engine (Bing) can correctly interpret your data.
Watch from 00:37 to 03:54. Focus on how you select a column (like 'City' or 'State') and use the 'Column tools' to set its 'Data category'. This simple action is what enables all map visuals to function.
To recap, for any column you want to use in a map (e.g., Country, State, City, Postal Code), you must:
- Go to the Data view in Power BI.
- Select the column.
- Go to the Column tools tab in the ribbon.
- Open the Data category dropdown and select the appropriate category (e.g., "State or Province").
An Overview of Map Types in Power BI
Power BI offers several map visuals. For your workshop, it's best to focus on the most common ones.
- Map (Bubble Map): This is the default map. It places bubbles over geographic locations. The size of the bubble can be tied to a measure, making it great for comparing values across many points (e.g., bigger bubble = more sales).
- Filled Map: This map fills in entire geographic areas (like states or countries) with color. The color can be based on a category or the shade can represent a value. It's best used when comparing regions, not individual points.
- Shape Map: Similar to a filled map but more stylized and less geographically precise. It's good for infographics where you want a simplified representation of a region.
- Azure Map: This is the modern, all-in-one map visual that Microsoft is actively developing. It includes the functionality of the others plus advanced features like clustering, real-time traffic layers, and 3D columns. You should guide your workshop participants to use this one for future-proofing their reports.
The same video provides a great overview of these options and the future direction of maps in Power BI.
Power BI MAP Visualization: Must-Know PBI MasterClass!!!
Let's continue with the 'Power BI MAP Visualization' video to understand the different maps and their uses.
Watch the following segments: The Future of Maps (03:54 - 04:57): This explains that older map visuals are being migrated to the Azure Map, reinforcing why it's the best one to learn. The Standard Map (04:57 - 07:20): See how to create a basic bubble map and, importantly, how to set up a location hierarchy (Country > State > City) to enable drill-down functionality. The Filled Map (10:15 - 14:11): Understand how this map works and see its drill-down capability in action. The Azure Map (21:20 - 27:10): Focus on the powerful features like clustering (which groups dense points together) and 3D columns. These are impressive features to showcase in a workshop.
For a supplementary text-based guide that you can use to create handouts, the following article provides a simple, step-by-step walkthrough.
Using Map Visuals In Power BI (Create One In 3 Easy Steps)
The article 'Using Map Visuals In Power BI' from Acuity Training provides a concise, step-by-step guide to creating basic and filled maps. It's a great reference for the fundamental mechanics.
Read the sections 'Creating a Basic Map' and 'Creating A Filled Map.' Notice how it walks through dragging the location field to the 'Location' well and a measure to the 'Size' well. This is the core workflow.
Part 2: Monitoring Performance with KPI Cards
While charts and maps are for exploration, KPI cards are for immediate answers. They are the headlines of your dashboard, designed to show performance against a target at a single glance.

There are two main ways to create KPI visuals in Power BI: the traditional KPI visual and the newer, more flexible Card visual.
The Standard KPI Visual
This visual is purpose-built to show one key metric against a target, with a trend line in the background. It's straightforward and effective for its specific job.
The core components you need are:
- Value: The main metric you are measuring (e.g.,
Total Units This Year). - Trend axis: A date field that provides the time context for the background chart (e.g.,
FiscalMonth). - Target: The goal you are measuring against (e.g.,
Total Units Last Year).
Key Performance Indicator (KPI) visuals - Power BI
The official Microsoft documentation, 'Key Performance Indicator (KPI) visuals,' provides a definitive guide on what KPIs are and how to build the standard KPI visual in Power BI.
Read through the sections 'When to use a KPI,' 'How to create a KPI,' and the formatting options. Pay close attention to the 'How to' section, which gives a clear, step-by-step process you can replicate in your workshop. Also, note the formatting option for 'Direction' (High is good / Low is good), which is key for interpretation.
The Modern (and more powerful) Card Visual
Recently, Power BI introduced a new "Card" visual that is far more flexible. It allows you to display multiple KPIs in a single container, add rich formatting, and include contextual "reference labels." This is the visual you should strongly emphasize in your workshop, as it allows managers to build truly professional-looking dashboards.
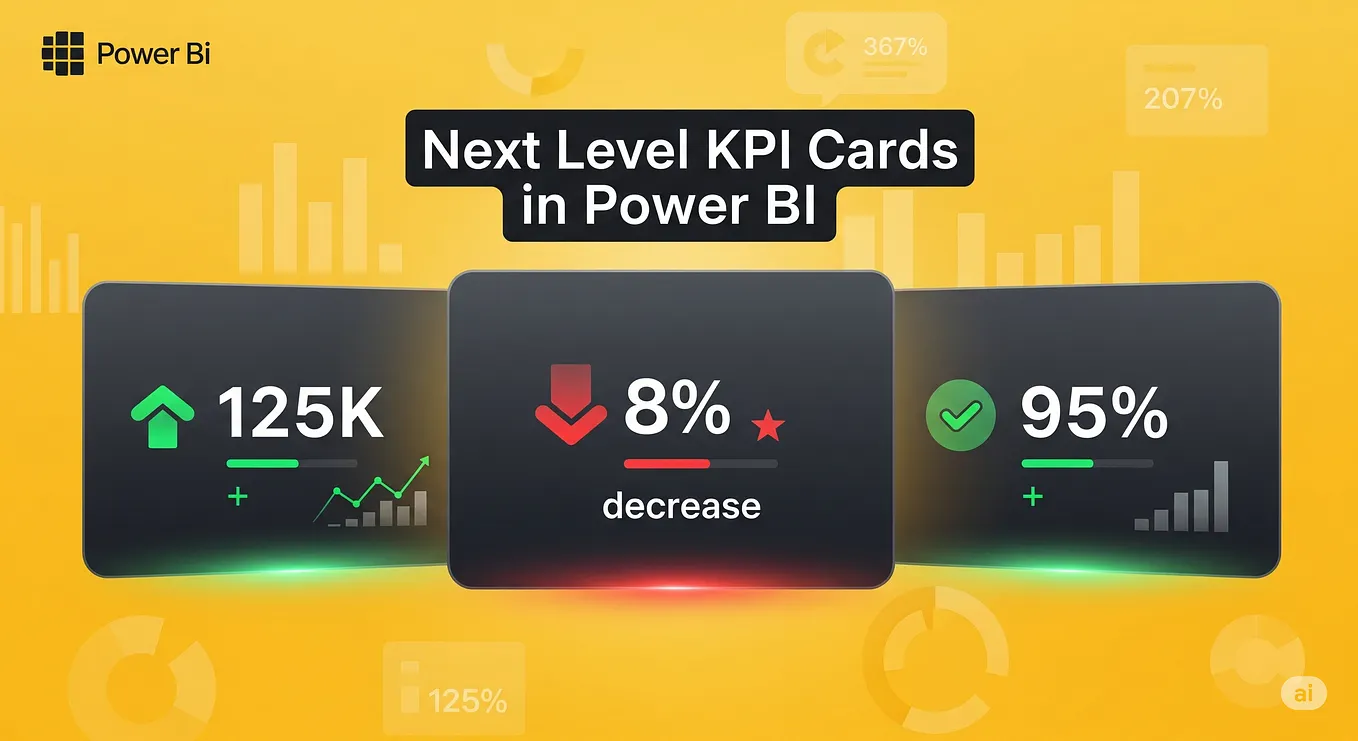
The following video is a complete masterclass on this new visual. It's an excellent resource for you and potentially even a video you could show clips of during your workshop.
Power BI Card Visuals - Full Tutorial (2026)
Leila Gharani's 'Power BI Card Visuals - Full Tutorial' is a fantastic, detailed walkthrough of the new card visual. It covers everything from basic setup to advanced formatting and contextualization.
Watch the following segments to learn the key features to teach your audience: Adding Multiple Cards (00:16 - 01:02): See how easy it is to add several metrics (like Sales, Quantity, Cost) to a single visual. Formatting Cards (03:50 - 05:28): Learn how to change the shape, add accent bars, and apply other formatting to make the cards visually appealing. This is great for engagement. Adding Context with Reference Labels (06:47 - 10:36): This is the most important part. Watch how to add comparison data (e.g., previous year sales, budget), calculate the variance, and apply conditional formatting to make the variance number green or red. This transforms a simple number into a powerful insight.
Test your understanding!
A regional manager wants a high-level overview of her territory's performance. She asks for two things on her dashboard:
- A visual that shows the total profit for each city in her region.
- A card that shows the region's total sales for the current year, how it compares to last year's sales, and whether the trend is positive or negative.
For each request, which visual would you use and which data fields would you place in the main configuration wells?
Show answer
- For profit by city: A Map (Bubble Map) is ideal. You would drag the
Cityfield to theLocationwell and theTotal Profitfield to theBubble sizewell. This will create a map where larger bubbles represent more profitable cities. - For the sales performance card: The modern Card visual is the best choice.
- You would drag
Total Sales This Yearinto the mainDatawell. - You would then add
Total Sales Last Yearas a Reference Label. - You could also create a measure for
% change vs Last Yearand add that as another reference label, applying conditional formatting (green for positive, red for negative) to its font color.
- You would drag
Conclusion
You've now done a deep dive into two of the most valuable visuals for a business dashboard. Maps provide geographic context that is impossible to get from a table, while well-designed KPI cards provide the instant performance summaries that managers need.
Key Takeaways for Your Workshop:
- For Maps: Emphasize that data must be categorized correctly first. Guide users toward the Azure Map as the modern, all-in-one solution and showcase its user-friendly features like clustering.
- For KPIs: Show both the standard KPI visual and the new Card visual. Stress the power of the new Card visual's Reference Labels and Conditional Formatting to add context and turn data into insight.
Preview of the Next Lesson:
Now that we have covered how to build individual visuals, the next step is to assemble them into a coherent and effective report. In our next lesson, we will focus on designing for clarity and impact. We'll learn how to add clear titles and labels, apply a consistent color scheme, and arrange visuals into a logical dashboard layout that tells a clear story.