Hello! Welcome back to the workshop design course.
In the previous lesson, we explored how Power BI's visuals interact with each other through cross-filtering and cross-highlighting, which is the key to creating a dynamic and intuitive user experience. Now that we understand how to make visuals "talk" to each other, we need to address a more fundamental question: how do we choose the right visuals in the first place?
This lesson addresses the learning outcome: Select appropriate chart types for different analytical questions. This is arguably one of the most important skills in dashboard design. A well-chosen visual tells a clear story, while a poor choice can confuse or mislead. Your goal is to equip the managers in your workshop with a simple, effective framework for making this decision.
Start with the Question, Not the Chart
The most common mistake beginners make is scrolling through the list of available charts and trying to make their data fit. The correct approach is the opposite: first, clarify the business question you want to answer, and then select the visual that answers it most effectively.
We can group most analytical questions into a few key categories. Understanding these categories provides a powerful framework for choosing visuals.
How to Choose the Right Chart for Your Data | #Tableau Course #136
The video 'How to Choose the Right Chart for Your Data' from Data with Baraa provides an excellent, tool-agnostic framework for this 'question-first' approach. It organizes charts into categories based on the analytical task.
Watch the introduction (00:00 - 00:34) to see the categories, and then skip to the summary (11:19 - 12:03) to hear the core methodology: understand the question, map it to a category, and then select the best chart. This is the central idea you'll teach in your workshop.
The main categories of questions you'll want your managers to think about are:
- Comparison/Ranking: How do different groups compare? Which is biggest or smallest?
- Change over Time (Trends): How has a metric evolved over days, months, or years?
- Part-to-Whole (Composition): How do different components make up a total?
- Relationship (Correlation): Is there a connection between two different measures?
- Distribution: How are the data points spread out? Where are the clusters or outliers?
- Geospatial: How does this data look on a map?
A Practical Guide for Your Workshop
For a non-technical audience of managers, providing a simple decision-making tool can be incredibly effective. A decision tree or "cheat sheet" can translate the abstract framework above into a concrete guide.
Here is an excellent example of a decision tree you can use as a handout or slide in your workshop.
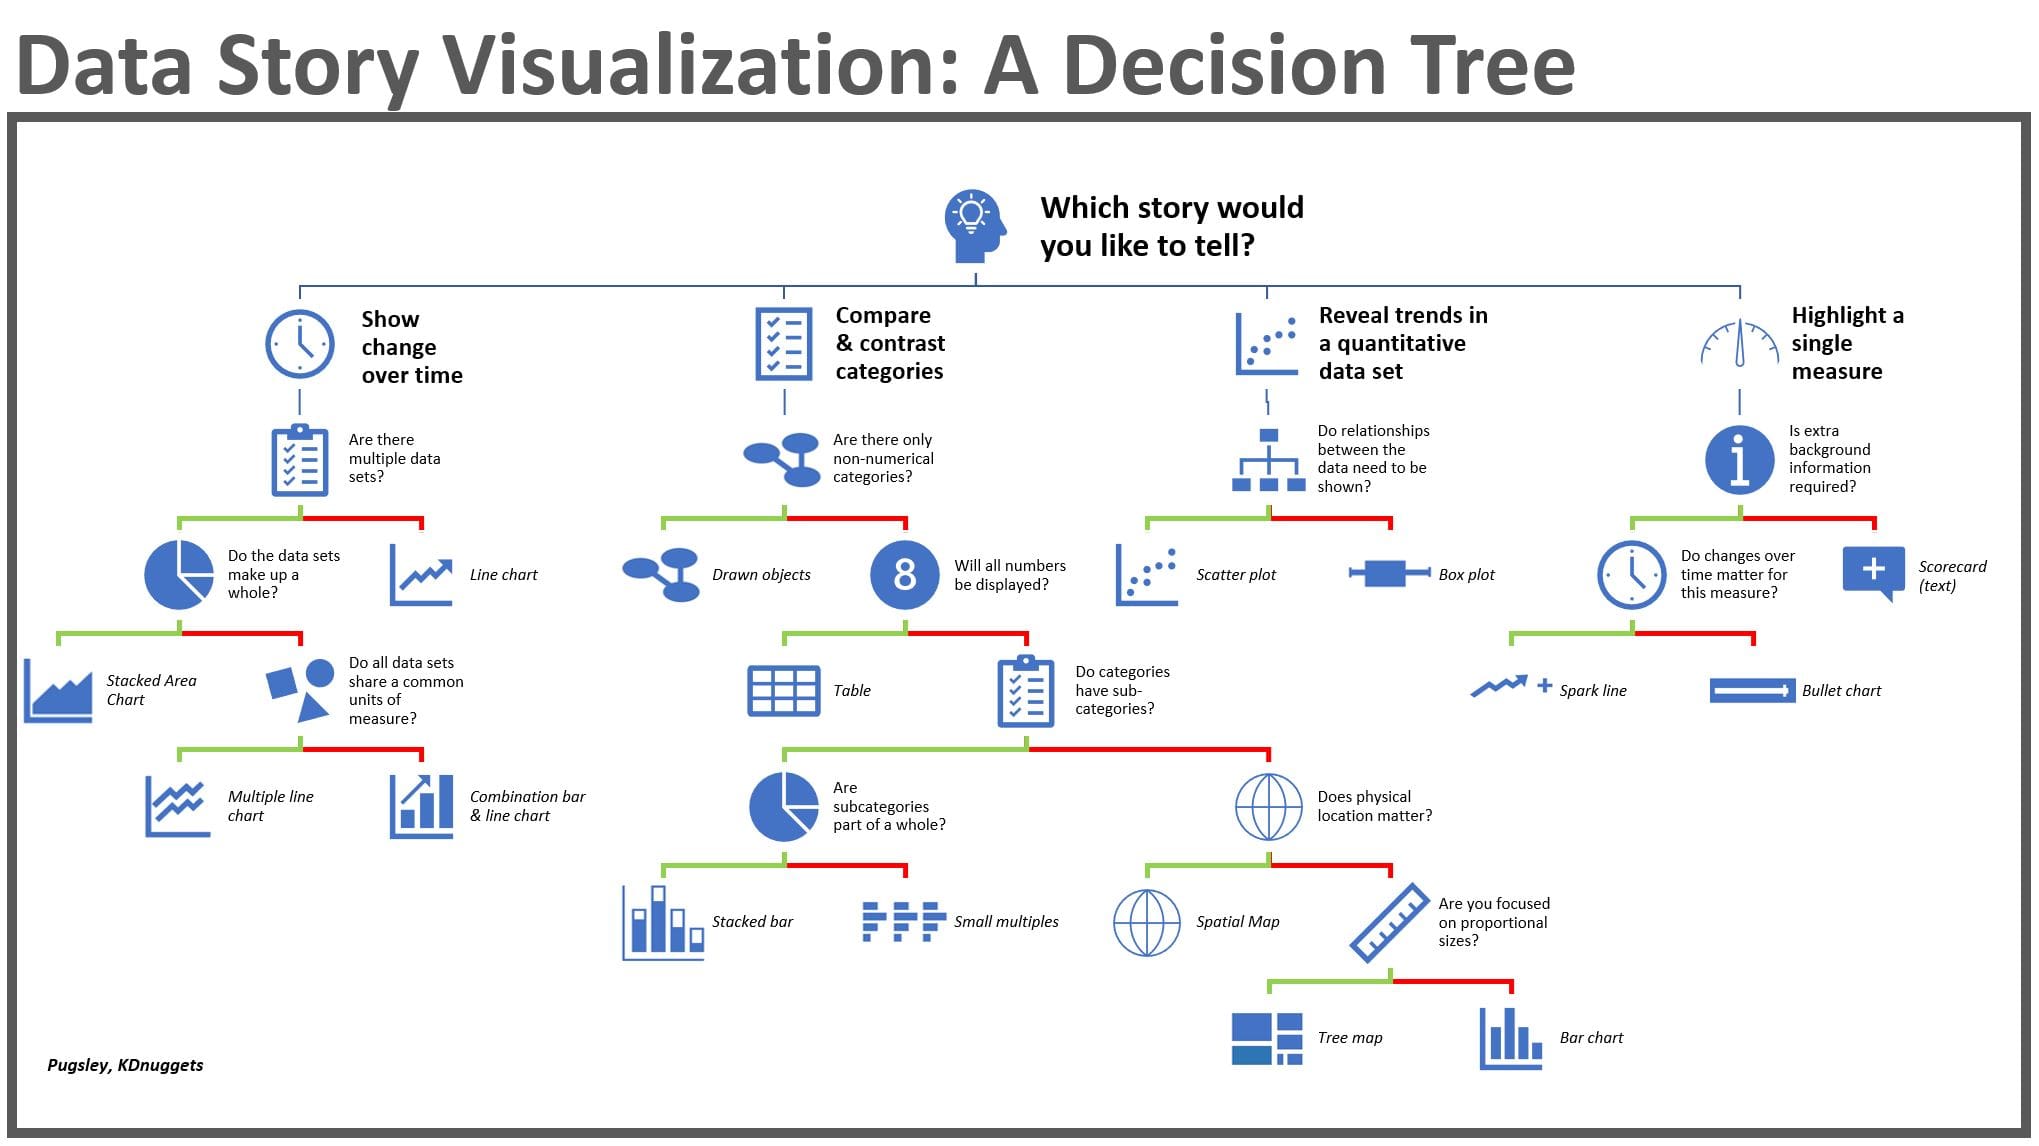
Walk your workshop participants through an example using this tree:
- Start: "Which story would you like to tell?" -> "I want to compare categories."
- Next Question: "Do your categories have sub-categories?" -> "Yes."
- Recommendation: -> "Use a Stacked Bar or Tree Map."
This makes the selection process less intimidating and more methodical.
Mapping Questions to Core Power BI Visuals
Now let's connect this framework to the specific visuals available in Power BI. We'll focus on the most common and effective charts that will cover 90% of a manager's needs.
The following video from Chandoo gives a fantastic, practical tour of the core Power BI visuals and when to use them.
How to pick the "perfect" chart for your situation in Power BI?
Watch this video, 'How to pick the 'perfect' chart for your situation in Power BI?', to see demonstrations of the most important chart types and their primary use cases directly within the Power BI interface.
Watch the sections covering Bar/Column charts (00:13-03:00), Line/Area charts (03:00-04:14), Pie/Donut charts (04:14-04:50), Tables/Matrices (05:47-06:50), and Scatter plots (06:50-08:38). Pay attention to the specific business scenarios he uses for each.
Let's summarize how these common Power BI visuals map to our analytical questions.
1. For Comparison and Ranking
- Question: "Which country has the highest sales?" or "How do our different product lines rank by profit?"
- Best Visuals: Bar and Column Charts.
- Column charts (vertical bars) are great when you have a time component (e.g., sales by month).
- Bar charts (horizontal bars) are excellent when you have long category names (e.g., product names, manager names).
- As seen in the video, these are the workhorses of data visualization for simple comparisons.
2. For Change Over Time (Trends)
- Question: "How did our website traffic change over the last year?"
- Best Visuals: Line and Area Charts.
- Line charts are perfect for showing the shape and trend of continuous data over time.
- Area charts are similar but fill the space under the line, emphasizing the magnitude or volume of change.
- Crucial Tip: As the video highlights, only use line charts when your horizontal axis is a time-based dimension (dates, months, years). A line chart of sales by product name is meaningless.
3. For Part-to-Whole (Composition)
- Question: "What percentage of our total revenue comes from each business unit?"
- Best Visuals: Pie and Donut Charts.
- These charts excel at showing how a total is divided into parts. The donut chart has the added benefit of having a hollow center where you can place a KPI card showing the total.
- Crucial Tip: Use these only when you have a small number of categories (ideally 5 or fewer). With too many slices, they become impossible to read. A bar chart is often a better alternative for comparing many parts.
4. For Relationships (Correlation)
- Question: "Is there a relationship between the number of sales calls an employee makes and the total revenue they generate?"
- Best Visual: Scatter Plot.
- A scatter plot places two different numeric measures on the X and Y axes. Each dot represents a data point (e.g., a salesperson). This allows you to spot patterns, clusters, and outliers instantly.
5. For Showing Detail
- Question: "I see the summary, but I need to see the exact numbers for each transaction."
- Best Visuals: Tables and Matrices.
- Never underestimate the power of a simple table. When exact values are needed, or when you need to look up specific information, tables are essential. A good dashboard often combines high-level charts with a detailed table for users who want to dig deeper.
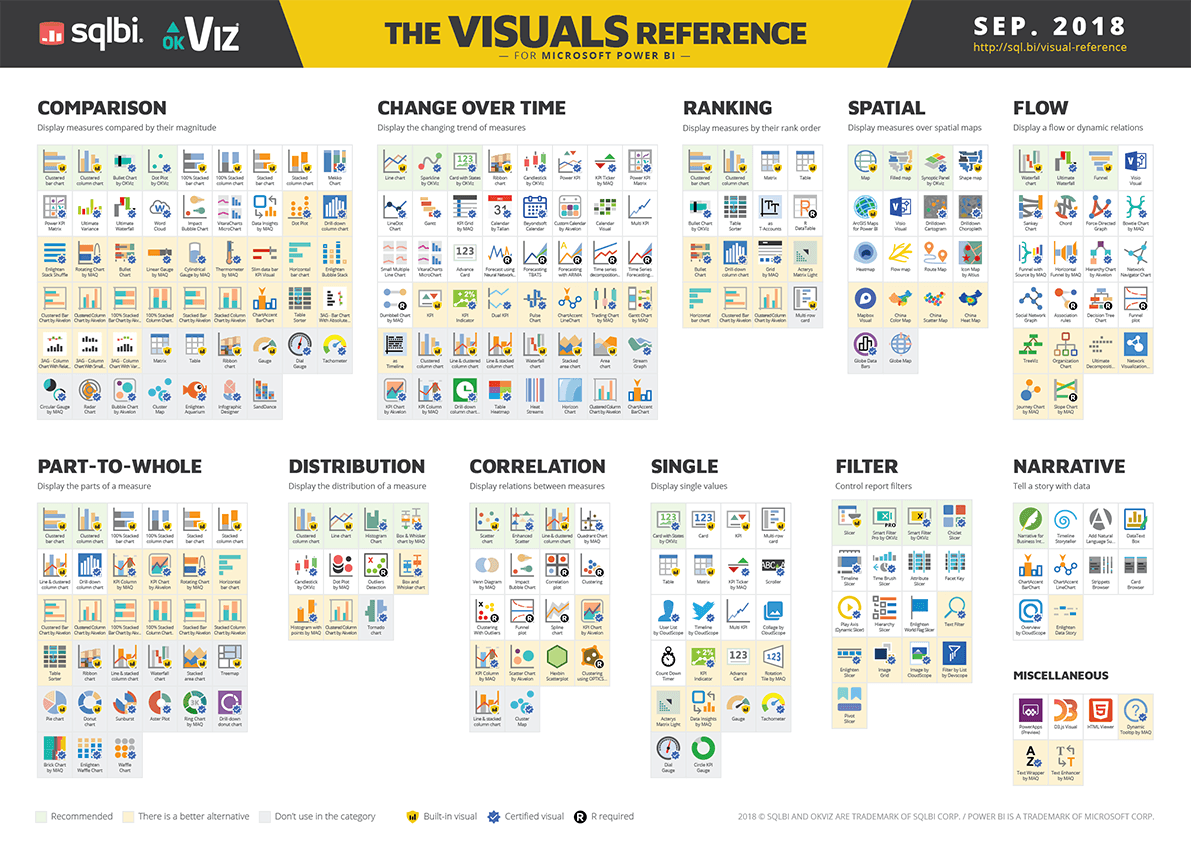
For a comprehensive reference, the official Microsoft documentation and the OKViz visual guide are excellent resources.
Visualizations overview in Power BI
The official Microsoft documentation, 'Visualizations overview in Power BI,' provides a structured list of available visuals categorized by their function. It's a great reference to have.
Skim the sections on 'Charts for comparison and trends,' 'Charts for part-to-whole relationships,' and 'Charts for distribution and relationships.' This will reinforce the categories we've discussed with the official Power BI terminology.
Test your understanding!
A factory manager wants a report to answer two questions:
- How does the daily production output (in units) compare across our three main assembly lines?
- How has the number of safety incidents trended month-over-month for the past year?
For each question, what chart type would you recommend and why?
Show answer
- For comparing production output: A Bar Chart or Column Chart is best. It will clearly show which assembly line is producing the most or least, making the comparison immediate and easy to understand.
- For tracking safety incidents: A Line Chart is the ideal choice. It will effectively show the trend of incidents over time, making it easy to spot if things are improving, getting worse, or if there are seasonal spikes.
Conclusion
In this lesson, you've learned a structured approach to selecting the right visual for any analytical task. This is a critical skill to pass on to the managers in your workshop, empowering them to tell clear and compelling stories with their data.
Key Takeaways for Your Workshop:
- Start with the Question: Always clarify the business question before choosing a chart.
- Use a Framework: Teach the main categories of analysis: Comparison, Trend, Part-to-Whole, and Relationship.
- Provide Simple Tools: Use visuals like the decision tree to make the selection process easy and repeatable for non-technical users.
- Master the Core Charts: Focus on the essentials: bar/column charts for comparison, line charts for trends, and pie/donut charts for composition. These will solve most business needs.
Preview of the Next Lesson:
We've now established a solid foundation for choosing the right visual. In the next lesson, we will do a practical deep-dive into creating two visual types that are especially important for managers: we will build maps to visualize geographic data and KPI cards for performance monitoring.