Hello! Welcome to our next lesson.
In the previous session, we focused on building specific, high-impact visuals: maps for geographic insights and KPI cards for at-a-glance performance monitoring. Now that we know how to create these individual components, our next task is to make them clear, professional, and instantly understandable.
A visual without proper labels is like a sentence without punctuation or context—the core idea might be there, but it's confusing and untrustworthy. This lesson directly addresses the learning outcome: Add clear titles, axis labels, and data labels to visualizations. We will explore the "why" behind each of these elements and the "how" of implementing them in Power BI. By the end, you will be fully prepared to teach your workshop participants how to transform their raw charts into polished, self-explanatory insights.
Why Good Annotation Matters
Before we dive into the tools, let's look at the end goal. A well-designed report should communicate its key messages with minimal effort from the viewer.
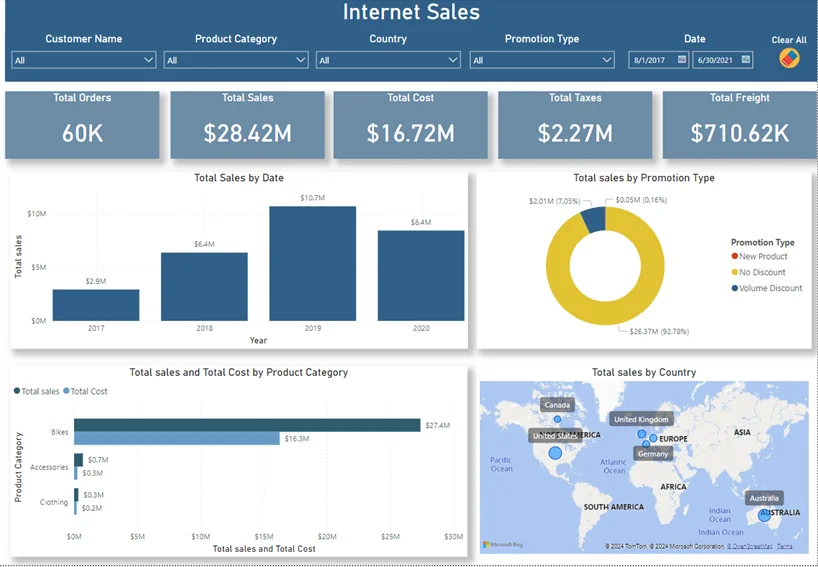
The core principle, whether in Excel, Power BI, or any other tool, is that every chart element should serve a purpose. Good titles and labels eliminate guesswork and ensure your audience understands the story you're telling.
The Control Center: Formatting in Power BI
Power BI has made formatting visuals more intuitive than ever. There are two main ways your workshop participants will interact with formatting options:
- The Format Pane: The traditional, comprehensive menu on the right-hand side that lists every possible customization.
- On-Object Interaction (The New Way): A more modern, contextual menu that appears directly on the visual itself. This is generally faster and more intuitive for beginners.
This new "On-Object" feature is currently in preview, but it's the future of Power BI's interface. It’s essential to show your workshop attendees how to enable it.
Easiest Way to Edit Visuals in Power BI - Watch before using the new features (Includes hidden tips)
The video 'Easiest Way to Edit Visuals in Power BI' by Leila Gharani provides an excellent introduction to the new 'On-Object Interaction' feature. This is the best starting point for teaching modern formatting.
Watch the first minute and a half (00:00 - 01:34). Pay close attention to: How to enable the feature: File > Options > Preview Features > On-Object Interaction. The new contextual buttons that appear when you select a visual, which allow you to either add data or format the visual.
Once enabled, selecting a visual will bring up small icons right next to it. This is the gateway to quickly adding and editing titles, labels, and other elements.

Part 1: Crafting Clear and Informative Titles
A title is the single most important piece of text on your visual. It must answer the viewer's first question: "What am I looking at?"
A good title is:
- Specific: "Sales by Region" is better than "Sales."
- Concise: Avoid jargon and unnecessary words.
Adding and Formatting a Static Title
This is the most basic and essential skill. You can teach your audience to do this in seconds using the on-object menus.
Easiest Way to Edit Visuals in Power BI - Watch before using the new features (Includes hidden tips)
Let's return to Leila Gharani's video, where she demonstrates how to use the Format pane to customize the title.
Watch the clip from 03:27 to 03:58. She shows how to find the 'Title' section in the Format pane and demonstrates two powerful features to highlight in your workshop: Subtitle: Perfect for adding a secondary line of context, like a date range or the data source. Divider: A simple line that visually separates the title from the chart, improving readability.
An Advanced Tip: Dynamic Titles
For more interactive reports, you can make titles dynamic so they update based on a user's filter selections. For example, if a user filters for "Bikes," the title could change from "Total Sales" to "Total Sales for Bikes."
This is an advanced topic that uses DAX (Data Analysis Expressions), but it's a powerful feature to mention.
How to Format Visuals in Power BI (Colours, Labels, Titles)
The article 'How to Format Visuals in Power BI' provides a clear explanation and a code snippet for creating dynamic titles. This is a great resource to have for more advanced questions.
Read the section titled '3) Titles that explain the “what”—and dynamic titles that change'. Focus on understanding the concept. You don't need to master DAX, but be able to explain that it's possible to link a title's text to a formula that reacts to filters.
Part 2: Clarifying with Axis Labels and Titles
If the title explains "what," the axes explain "of what" (the categories on the X-axis) and "how much" (the values on the Y-axis). Failing to label axes is a common mistake that renders a chart useless.
It's important to distinguish between two types of axis text:
- Axis Labels: The individual values along the axis (e.g., "Jan," "Feb," "Mar" or "$10K," "$20K").
- Axis Title: A single phrase describing the entire axis (e.g., "Month" or "Sales Revenue in USD").
Microsoft's official documentation provides a clear, step-by-step guide to formatting these.
Get Started Formatting Report Visualizations - Power BI
The official documentation, 'Get Started Formatting Report Visualizations,' walks through the options available in the Format pane for axes.
Read the section 'Change axis properties'. It shows how to find the X-axis and Y-axis cards in the Format pane. Emphasize these key actions for your workshop: Toggling the axis Title on or off. Changing font size and color for readability. Crucially, adding a descriptive title that includes units (e.g., 'Revenue ($M)').
Test your understanding!
You create a bar chart showing the number of support tickets closed each month. The Y-axis shows numbers like 100, 200, 300, and the X-axis shows "Jan", "Feb", "Mar".
What information is missing, and how would you add it using the Format pane?
Show answer
The chart is missing axis titles.
- The Y-axis title is needed to explain what the numbers 100, 200, 300 represent. You would go to the Format pane, open the Y-axis card, expand the Title section, and enter "Number of Tickets Closed".
- The X-axis title might be useful to clarify the time period. You could add an X-axis title like "Month of 2024".
Without these titles, a viewer might not know if the Y-axis represents tickets, hours, or dollars.
Part 3: Adding Precision with Data Labels
Sometimes, the trend or comparison is enough. Other times, your audience needs to see the exact numbers. This is where data labels come in. They display the value directly on the bar, line point, or pie slice.
Activating and Customizing Data Labels
Data labels can be turned on with a single click. The key is teaching users how to format them so they add clarity, not clutter.
Get Started Formatting Report Visualizations - Power BI
Let's refer back to the Microsoft documentation, which covers Data Labels in detail.
Read the sections 'Add data labels' and 'Customize data labels'. Note the following key formatting options you can teach: Display units: Changing large numbers like 5,400,000 to a more readable '5.4M'. Decimal places: Reducing visual noise by showing '$5.4M' instead of '$5,432,109.87'. Position: Placing the label inside or outside the bar to improve readability.
For stacked charts, you can also show Total labels, which display the sum for the entire stack. This is often more useful than labeling every small segment. You can find this option right next to Data labels in the Format pane.
Conclusion: From Raw Chart to Polished Insight
You now have a complete framework for teaching one of the most critical aspects of report design. By ensuring every visual is clearly labeled, you empower managers to create reports that are not only accurate but also trustworthy and easy to act upon.
Key Takeaways for Your Workshop:
- Clarity is King: A chart is only useful if it can be understood quickly.
- Use On-Object First: Encourage users to start with the new on-object menus for quick edits.
- The Annotation Checklist:
- Does it have a clear Title that says what it is?
- Do the Axes have titles that include units?
- Are Data Labels used where precise numbers are important?
Preview of the Next Lesson:
We've now covered how to create and label individual visuals. In the next lesson, Designing Visualizations for Clarity and Impact, we will zoom out. We'll learn how to apply a consistent color scheme and arrange our well-labeled visuals into a logical, easy-to-read dashboard layout that tells a coherent story.