Hello! Welcome back to our module on building interactive reports in Power BI.
In the last lesson, we took a comprehensive tour of the Power BI Desktop interface. You learned to navigate the Report, Data, and Model views and identified the key tool panes: Fields, Visualizations, and Filters. Think of that as learning your way around the kitchen. Now, it's time to start cooking.
This lesson directly addresses the learning outcome: Create bar charts to compare categories and line charts for trends. These two chart types are the absolute workhorses of business reporting. For the managers in your workshop, mastering these two visuals will cover a significant portion of their daily analytical needs. We will focus on the "what," "why," and "how" of creating each one.
Comparing Categories with Bar and Column Charts
The first fundamental task in data analysis is comparison. How do sales in Region A compare to Region B? Which product is our top performer? For these questions, bar and column charts are the ideal tools.
- Column charts use vertical bars and are great for comparing values across a handful of categories (e.g., sales by quarter).
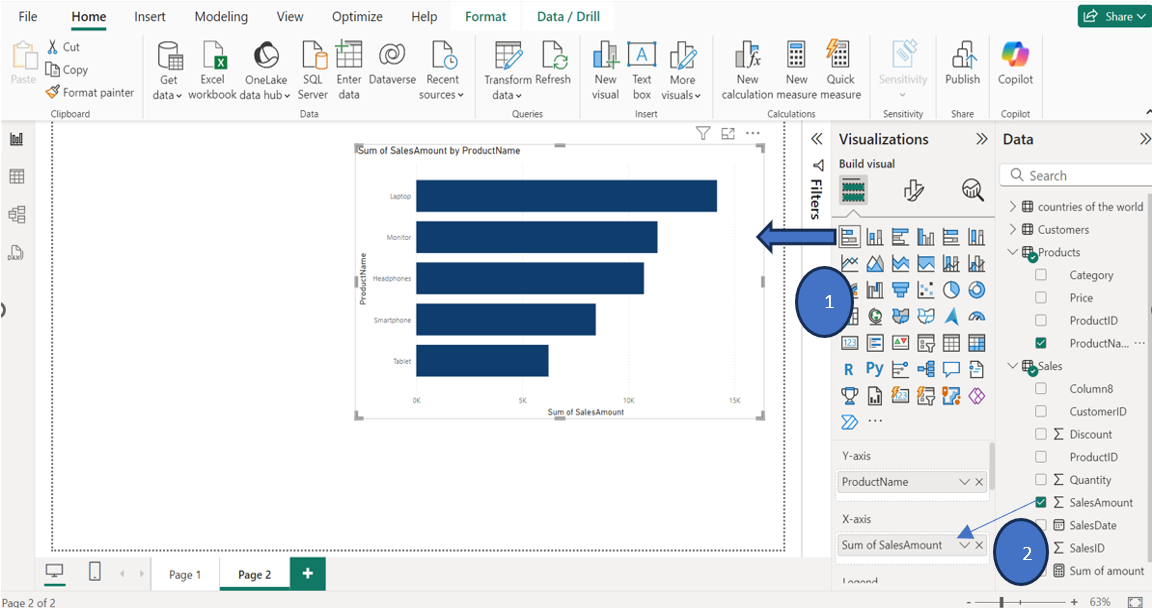
- Bar charts use horizontal bars. They are particularly effective when you have long category names (e.g., full product names) or many categories to compare, as the vertical axis is easier to scroll and read.
Creating them involves the same simple mechanic: select the visual and drag your data into the correct "wells."
To see this in action, the following video offers a very clear and direct demonstration of creating a column chart. This is a perfect starting point for your workshop participants.
Your first 10 minutes of Power BI - A no-nonsense getting started tutorial for beginners
The YouTube channel Chandoo provides a no-nonsense guide to creating a basic column chart. This clip demonstrates the core drag-and-drop process that is central to Power BI.
Watch from 03:29 to 04:59. Pay close attention to how a categorical field ('Country') is dragged to the X-axis and a numerical field ('Boxes Shipped') is dragged to the Y-axis.
As you saw, Power BI automatically creates the chart. The fields you use determine what the chart shows.
Adding More Detail with Stacked Charts and Legends
Sometimes you want to compare totals and see the breakdown of those totals. For example, you might want to see total sales per product, broken down by which customer bought them. This is where a stacked bar chart and the Legend field come in.
The next video demonstrates how to create a stacked bar chart and use the Legend well to add another dimension of data to your comparison.
Popular Visualizations in Power BI | Microsoft Power BI for Beginners
The YouTube channel Alex The Analyst provides a good example of building a slightly more complex visual. This demonstrates how to add a second categorical variable to break down the bars.
Watch from 01:27 to 02:47 to see a stacked bar chart being created. Then, watch from 02:57 to 04:20 to see a 100% stacked column chart, which is useful for comparing proportions rather than absolute values. Notice how dragging a field into the 'Legend' well automatically creates the color-coded segments.
When you teach this, emphasize to your managers that the Axis defines what they are comparing (the bars), and the Legend defines how each bar is broken down (the colored segments).
Tracking Trends with Line Charts
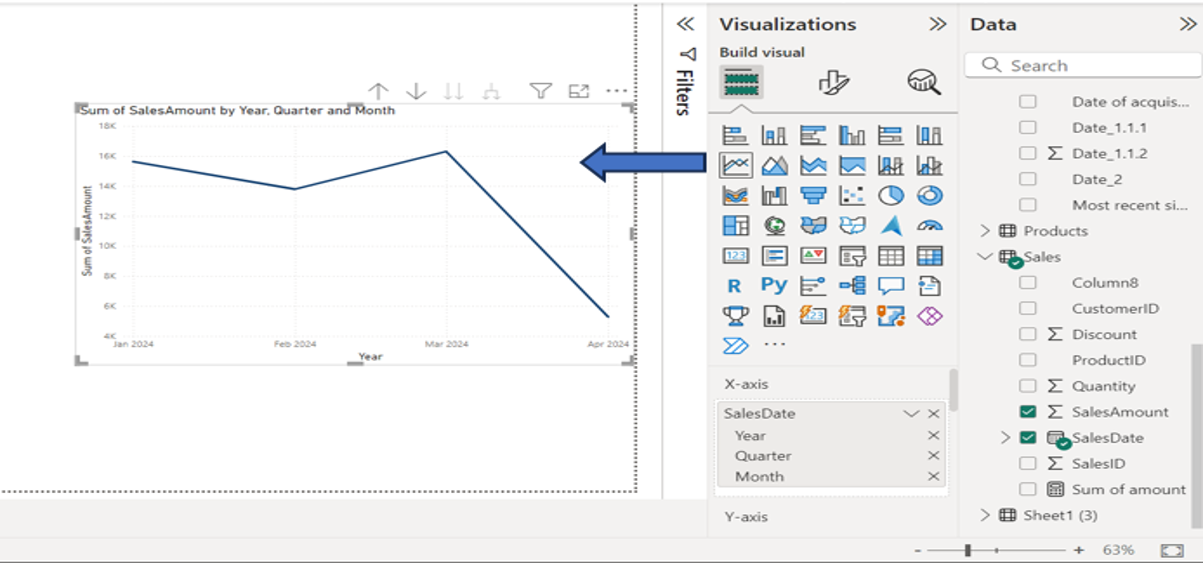
While bar charts are for comparing static categories, line charts are the go-to visual for showing how a numerical value changes over a continuous period, most often time. How did our sales perform month-over-month last year? Is website traffic increasing? A line chart answers these questions instantly.
Creating a line chart follows the same process, but you'll use a date field for the axis.
Working with Date Hierarchies
A key feature your workshop attendees will appreciate is Power BI's automatic date hierarchy. When you add a date field to a chart, Power BI allows you to "drill down" from years to quarters, months, and days.
This next video clip is excellent for demonstrating how to create a line chart and, more importantly, how to use the drill-down functionality to explore trends at different levels of time.
Your first 10 minutes of Power BI - A no-nonsense getting started tutorial for beginners
Let's return to the Chandoo video, which has a superb explanation of line charts and the date hierarchy concept. This is often a 'wow' moment for new users.
Watch from 06:48 to 08:26. Focus on how the chart initially shows one data point for the year, and how using the 'drill down' buttons reveals the quarterly and monthly trends hidden within the data.
Test your understanding!
A manager in your workshop has a dataset with Sales Amount, Order Date, and Store Location. They ask you for help with two tasks:
- They want to see which store location had the highest total sales last year.
- They want to see if sales in the top-performing store were consistent or if they had a big spike in a particular month.
What chart type would you recommend for each task, and which fields would go on the main axes?
Show answer
- For comparing total sales across different locations, a bar chart (or column chart) is best. You would put
Store Locationon the Y-axis (category) andSales Amounton the X-axis (value). - To see how sales changed over time for a specific store, a line chart is the right choice. You would put
Order Dateon the X-axis (time) andSales Amounton the Y-axis (value). You would then use a filter (which we'll cover later) to select only the top-performing store.
For more detailed, step-by-step written instructions on creating and formatting line charts, the following guide is a useful resource to have on hand for your workshop. It also covers important practical steps like changing the default summarization from 'Sum' to 'Average'.
Building Line Charts in Power BI
The article 'Building Line Charts in Power BI' by Pluralsight provides a clear, step-by-step walkthrough. It's a great reference for reinforcing the concepts shown in the videos.
Read the sections 'Adding Line Chart' and 'Format Line Charts'. Pay attention to the part where the aggregation is changed from 'Sum' to 'Average'—this is a common and important adjustment. The formatting section also shows how to add data labels and use the Legend field, reinforcing our earlier points.
Conclusion
You have now learned the fundamentals of creating the two most essential visual types in Power BI. You are equipped to guide your workshop participants through building their first meaningful charts, moving from raw data to actionable insight.
Key Takeaways:
- Bar/Column Charts for Comparison: Use these when you need to compare a numerical value across different categories (e.g., sales by product, expenses by department).
- Line Charts for Trends: Use these to track a numerical value over time (e.g., revenue by month, website visitors by day).
- The Core Mechanic: The process is consistent: select a visual, then drag a categorical/date field to the Axis and a numerical field to the Values well. Use the Legend well to add a second categorical breakdown.
- Date Hierarchies: Power BI's automatic date hierarchies are a powerful feature for drilling into time-based trends.
Preview of the Next Lesson:
While charts are great for visualizing patterns, managers often need to see the underlying numbers in a summarized format. In our next lesson, we will cover how to use tables and matrices to present summarized data, another critical component of a comprehensive business report.