Hello! Welcome back to our journey through building interactive reports in Power BI.
In our last lesson, you learned how to create bar charts for comparing categories and line charts for tracking trends. These visual tools are excellent for quickly spotting patterns and outliers. However, sometimes managers need to see the precise numbers behind the visuals—the kind of detailed, summarized data they are used to seeing in spreadsheets.
This lesson directly addresses that need and covers the learning outcome: Use tables and matrices to present summarized data. We'll explore the difference between these two powerful visuals, learn when to use each one, and see how to build and format them to provide clear, actionable information. For the managers in your workshop, mastering tables and matrices is like bringing the best features of Excel directly into their interactive dashboards.
Why Summarize? From Raw Data to Insight
Before we build anything, it's crucial to understand the purpose of these visuals. Your managers often receive raw data in the form of massive spreadsheets with thousands of rows of transactions. The goal of a tool like Power BI is to transform this raw data into a clean, aggregated summary.
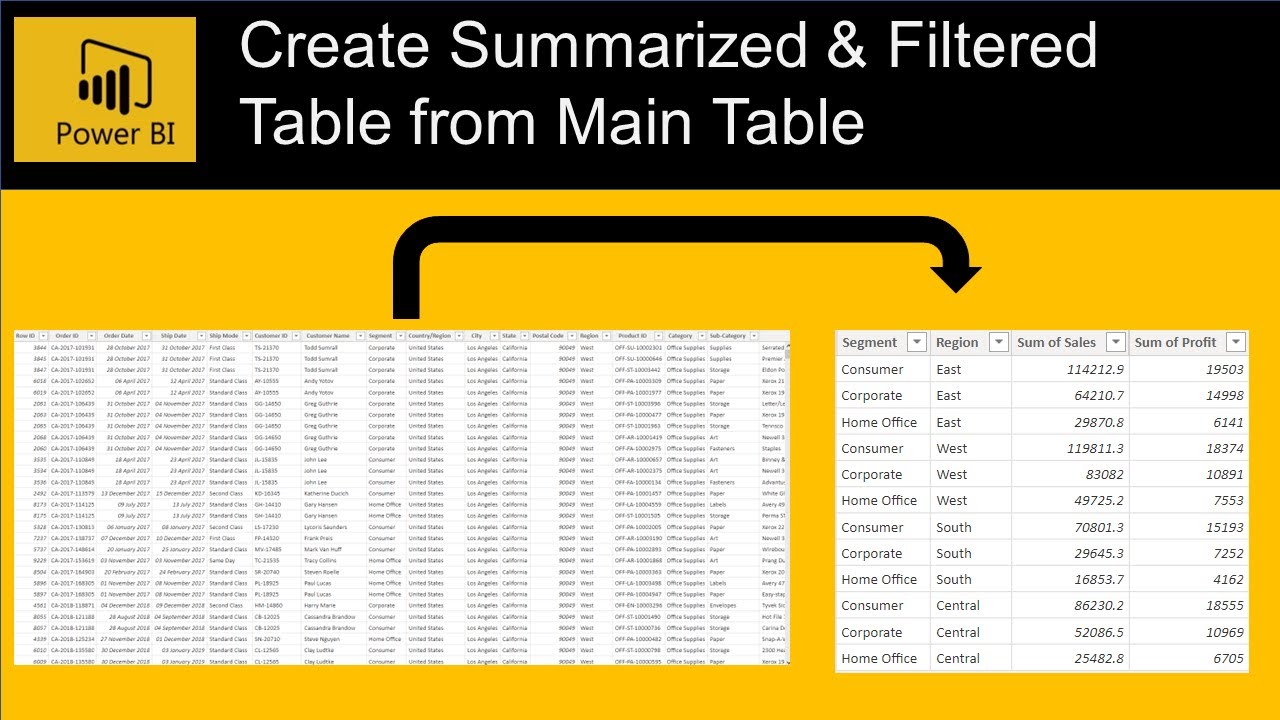
Table vs. Matrix: Choosing the Right Tool
Power BI offers two primary ways to display data in a grid: the Table and the Matrix. While they look similar, they serve different purposes.
- A Table displays data in a simple, flat, two-dimensional grid with rows and columns. It's best for showing detailed records or a simple list without complex grouping. Think of it as a standard spreadsheet view.
- A Matrix is more like a pivot table in Excel. It supports a stepped layout and allows you to group data by both rows and columns, creating a more complex, hierarchical view with totals and subtotals.
To get a firm grasp of these differences, please read the following article. It provides clear definitions and includes a very helpful comparison table that you can adapt for your workshop.
Power BI Table vs Matrix: Which One Works Best for Your ...
The article 'Power BI Table vs Matrix' from Power BI Training Australia offers a fantastic breakdown of when to use each visual. Pay close attention to the comparison tables.
Read the sections 'What is a Table Visual?', 'What is a Matrix Visual in Power BI?', 'Primary Differences', and review the 'Table vs Matrix' scenario table. This will give you a clear framework for deciding which visual to use.

Building a Simple Table with Added Intelligence
Let's start with the basics: creating a table. For your workshop, you'll want to show managers how to quickly generate a list of key numbers. But we can go a step further and introduce one of Power BI's "no-code AI" features: Quick Measures. This allows users to perform powerful time-intelligence calculations like Year-over-Year change without writing a single line of code.
This video provides an excellent demonstration.
Power BI Tutorial For Beginners | Create Your First Dashboard Now (Practice Files included)
In this tutorial, Leila Gharani demonstrates how to build a table and then enhance it with powerful Quick Measures. This is a perfect example of a high-value, low-effort feature for managers.
Watch from 14:04 to 17:22. First, see how a basic table is created (14:04-14:36). Then, pay close attention to how 'Quick Measure' is used to add 'Year over year change' (14:36-16:48) and 'Year to date total' (16:48-17:22).
The ability to add calculations like Year-over-Year percentage change with a few clicks is a significant "wow" factor for business users and a core part of making AI accessible.
Building a Powerful Matrix for Multi-Dimensional Analysis
When your analysis requires grouping data by both rows and columns, the Matrix is the tool you need. Think of it as the Power BI equivalent of an Excel PivotTable.
Let's see how to create a basic matrix with a nested hierarchy in the rows.
Improve the Look and Feel of Tables and Matrix in Power BI
The channel 'Goodly' has a great video on formatting matrices. We'll start with the first part, which demonstrates how to create the initial matrix.
Watch from 00:43 to 01:27. Notice how multiple fields (Year, Quarter, Sub-Category) are dragged into the 'Rows' well to create a natural drill-down hierarchy.
This simple drag-and-drop action creates an interactive, hierarchical report that users can explore—a concept we'll build on with drill-down features later. For a step-by-step written guide, you can also refer to the official Microsoft documentation, "Create a Matrix Visual in Power BI" (ID: LINK).
Test your understanding!
A manager wants a report showing total profit. They want to see each Product Category as a separate row. They also want to see the profit broken down across different Sales Regions as columns. Finally, they need to see a total profit for each Product Category and a grand total for all sales.
Which visual should you recommend: a Table or a Matrix? Why?
Show answer
You should recommend a Matrix. A table cannot group data across both rows and columns simultaneously. The matrix is designed for this pivot-table-like functionality.
Product Categorywould go in the Rows well.Sales Regionwould go in the Columns well.Profitwould go in the Values well.
The matrix will automatically calculate the row totals (subtotals for each category) and the grand total.
Formatting for Clarity and Impact
A default matrix can be dense and hard to read. Teaching your managers a few key formatting tricks will dramatically improve the usability of their reports. These tips turn a data-dump into a professional-looking summary.
Let's return to the "Goodly" video, which is a masterclass in this.
Improve the Look and Feel of Tables and Matrix in Power BI
This video walks through several high-impact formatting changes to make a matrix cleaner and more insightful.
Watch the following three segments to learn key formatting techniques: Improve Layout (01:52 - 03:37): Learn how to change from the default 'stepped layout' to a classic table layout, which is much more familiar to Excel users. Reduce Clutter (03:37 - 05:32): See how to apply a 'Minimal' style and selectively control subtotals to make the visual cleaner. Add Visual Cues (09:55 - 11:11): Discover how to use conditional formatting to add 'data bars', which provide a quick visual comparison of numbers directly within the matrix.
These formatting skills are what separate a basic report from a polished, professional one. Encouraging managers to use these will help them communicate their data stories more effectively.
Conclusion
You now have the tools to teach your workshop participants how to present summarized data effectively. You've learned not just how to build tables and matrices, but also the critical thinking behind choosing the right one and the formatting techniques to make them clear and insightful.
Key Takeaways:
- Tables for Flat Lists: Use tables to display detailed, row-level data without complex grouping.
- Matrices for Pivoting: Use matrices when you need to group and summarize data across both rows and columns, similar to an Excel PivotTable.
- Leverage Quick Measures: This no-code feature is a perfect example of accessible AI, allowing managers to perform complex time-intelligence calculations easily.
- Formatting is Key: Simple changes to layout, style, subtotals, and adding conditional formatting can transform a dense grid into a clear and compelling summary.
Preview of the Next Lesson:
We've now built several types of visuals: charts, tables, and matrices. But a Power BI report isn't static. In the next lesson, Apply slicers and page-level filters for user-driven exploration, we'll learn how to add controls that allow managers to interact with the report, slice and dice the data, and discover insights on their own.