Hello! Welcome back to the workshop preparation series.
In the last lesson, we focused on presenting data clearly using tables and matrices, turning raw numbers into structured summaries. We built visuals that are static but informative. Now, it's time to bring them to life. A key strength of Power BI is its ability to turn a report into a dynamic tool for exploration, empowering managers to answer their own questions.
This lesson addresses the learning outcome: Apply slicers and page-level filters for user-driven exploration. We will cover the two primary methods for filtering data in Power BI: slicers and the Filter pane. You will learn how each one works, when to use them, and how to configure them to create an intuitive and powerful experience for the managers in your workshop.
From Static Reports to Interactive Dashboards
The goal of this lesson is to move beyond just presenting data to interacting with it. For the managers attending your workshop, this is often the "aha!" moment. Instead of requesting a new report for every question (e.g., "How did we do in the North region last quarter?"), they can find the answer themselves with a few clicks. This is the essence of self-service analytics.
We will explore two key tools for this:
- Slicers: Interactive controls that sit directly on the report canvas.
- Filters: Rules applied "behind the scenes" in the Power BI Filter pane.
Let's dive into what they are and how they differ.
Understanding Slicers vs. Filters
At a high level, both slicers and filters do the same thing: they narrow down the data shown in your visuals. However, they are designed for different purposes and users.
- Slicers are visual elements on the report page, like dropdowns or buttons. They are intended for the end-user (the manager) to interact with.
- Filters are configured in a dedicated pane. They are typically set up by the report creator (you or the manager building the report) to establish a baseline context.
To get a clear overview, please read the introductory sections of the following guide.
How to Use Filters and Slicers in Power BI
This guide from Expertrain, titled 'How to Use Filters and Slicers in Power BI,' clearly explains the fundamental difference between these two tools. It's a great starting point.
Read the 'Introduction' and 'What Are Filters and Slicers?' sections. Focus on the core idea: filters are 'behind-the-scenes' tools, while slicers are 'front-end' tools for exploration.
This table provides an excellent summary of the differences, which you can use as a teaching aid in your workshop.
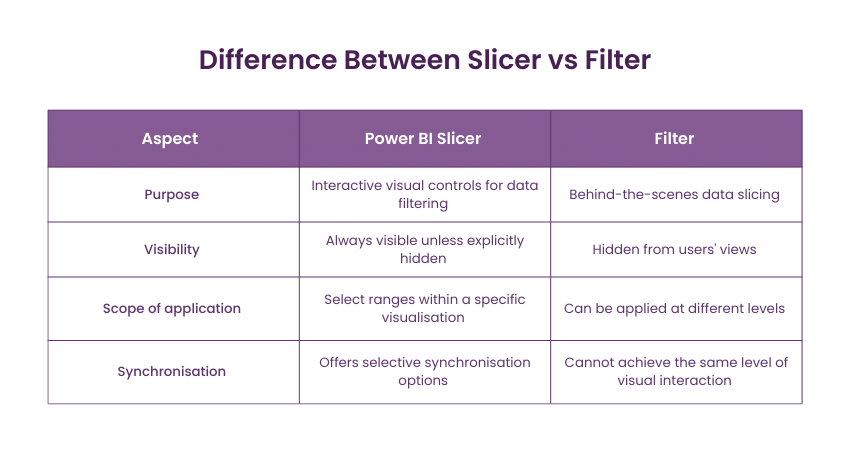
Adding Slicers for User-Driven Exploration
Slicers are the most visible and intuitive way for managers to explore data. They are added to the report just like any other visual.

Let's watch a short video that demonstrates how to add a slicer and introduces the Filter pane, which we'll discuss next.
BEST WAY to FILTER your data / SLICER vs FILTER PANE // Beginners Guide to Power BI in 2022
This video from the 'Fernan | Power BI' channel provides a clear, practical look at both slicers and the Filter pane. We'll start by focusing on how to add a slicer.
Watch the segment from 01:14 to 01:51. Observe how a slicer visual is added to the page and populated with a data field ('Category Name'). Note how selecting a value in the slicer instantly filters the other visuals.
Once a slicer is on the page, you can customize its appearance. For example, you can change it from a list to a dropdown to save space, or even to horizontal buttons. You can show your workshop participants how to do this in the Format visual pane under Slicer settings.
Using the Filter Pane for Report-Level Control
The Filter pane offers a more powerful, behind-the-scenes way to control the data. Its key feature is the ability to apply filters at different levels, or "scopes."
This video segment explains these scopes clearly.
BEST WAY to FILTER your data / SLICER vs FILTER PANE // Beginners Guide to Power BI in 2022
Let's return to the 'Fernan | Power BI' video to understand the different levels of filtering available in the Filter pane.
Watch from 01:51 to 03:22. Pay close attention to the three scopes explained: Filter on this visual: Affects only a single, selected visual. Filter on this page: Affects all visuals on the current page (similar to a slicer). Filter on all pages: Affects the entire report.
For your workshop, the most important distinction for managers to grasp is between Page-level filters and Slicers. Both filter the entire page, but their use cases differ. A page-level filter is good for setting a condition that the user doesn't need to change often, while a slicer is for frequent, interactive filtering.
Test your understanding!
A manager asks you to build a sales dashboard. They want a main page that always shows data for the "Current Fiscal Year" only. They don't want to have to select this every time they open the report. On that same page, they want to be able to easily switch between different product categories and sales regions.
How would you use slicers and filters to meet this request?
Show answer
The best approach is to use a combination of both tools:
- Filter Pane: Drag the
Fiscal Yearfield into the Filters on this page well. Set the filter type to 'Relative date' and choose 'is in this year'. You can then lock or hide this filter so the user doesn't change it. - Slicers: Add two slicers to the report canvas: one for
Product Categoryand one forSales Region. This makes them visible and easy for the manager to use for exploration.
Advanced Control: Deciding What Gets Filtered
By default, a slicer affects every other visual on the page. But what if you don't want that? For instance, you might have a KPI card showing total company sales that should not change when a user filters by a specific region. Power BI gives you precise control over these interactions.
Furthermore, what if you want a slicer on one page to also apply to another page? This is essential for creating a cohesive, multi-page report. The Sync slicers feature handles this.
The following video from "Analytics with Nags" explains these important concepts.
Filters vs Slicers in Power BI Tutorial (39/50)
This video, 'Filters vs Slicers in Power BI Tutorial', dives into the key reasons for choosing a slicer over a page-level filter, focusing on interaction control and multi-page syncing.
Watch these two key segments: Controlling Interactions (02:52 - 04:40): This part demonstrates how to use 'Edit Interactions' to make a slicer ignore a specific visual. This is a key advantage of slicers over page-level filters. Syncing Slicers Across Pages (05:23 - 07:18): This segment shows how the 'Sync slicers' feature allows a single slicer to filter visuals across multiple report pages, a very powerful feature for user convenience.
The official Microsoft documentation on Slicers in Power BI (ID: LINK) is also an excellent, comprehensive resource you can refer to for more detail on these features.
Conclusion
In this lesson, you've learned how to empower your workshop participants to turn their reports into interactive analytical tools. Giving managers the ability to filter, slice, and dice data themselves is a fundamental step in fostering a data-driven culture.
Key Takeaways for Your Workshop:
- Slicers are for Users: Use slicers for common filters (like date, region, or category) that you want managers to interact with directly on the report canvas.
- Filters are for Creators: Use the Filter pane to set up the underlying context of a report, such as filtering out irrelevant data or setting a default scope that users won't change.
- Different Scopes for Different Needs: The Filter pane can operate on a single visual, a whole page, or the entire report.
- Slicers Offer More Control: With features like Edit Interactions and Sync Slicers, slicers provide more flexible and sophisticated user experiences than page-level filters.
Preview of the Next Lesson:
We've just seen how to explicitly filter a report using slicers. But Power BI also has a powerful implicit filtering capability. In the next lesson, Describe how visuals interact through default cross-filtering, we'll explore what happens when you click on a bar in a bar chart or a segment in a pie chart, and how that simple action can be used to filter all other visuals on the page.