Hello! Welcome to the second lesson in our module on "Building Interactive Reports in Power BI."
In our last lesson, we successfully bridged the gap between data preparation and visualization by using the Close & Apply command. Our clean data, meticulously prepared in Power Query, is now loaded into the Power BI data model. This is a major milestone in the workflow you'll be teaching.
Now that the data is ready, our next step is to become familiar with our new environment: the Power BI Desktop. The learning outcome for this lesson is to navigate the Power BI Desktop interface and its main components. Think of this as a guided tour of your report-building studio. For the managers in your workshop, a clear orientation is essential to build confidence and prevent them from feeling overwhelmed by a new tool.
Getting Started with Power BI Desktop
Before we dive into the interface, let's cover the first step your workshop attendees will take: opening the application.
Your first 10 minutes of Power BI - A no-nonsense getting started tutorial for beginners
The video 'Your first 10 minutes of Power BI' from the Chandoo YouTube channel provides a very quick and clear introduction to opening Power BI for the first time. This is a great way to start your workshop.
Watch from 00:13 to 02:12. The video will show you how to open the application, dismiss the initial welcome screen, and it provides a high-level overview of what Power BI is for—which is a great message for your audience.
For your workshop materials, it's also helpful to have a written guide on how to install the application.
Power BI Tutorial for Beginners
The article 'Power BI Tutorial for Beginners' from DataCamp offers excellent written instructions on installing Power BI Desktop. The key takeaway for your managers is the recommendation to install from the Microsoft Store, as it handles updates automatically and doesn't require admin rights.
Read the section titled 'Downloading and Installing Power BI Desktop'. Focus on the advantages of using the Microsoft Store version, as this is a practical tip that simplifies IT-related issues for your attendees.
A Map of the Power BI Desktop
Once Power BI is open and data is loaded, you're presented with the main report-building interface. It can look busy at first, but it's logically organized into a few key areas. Let's use the following image as our map.
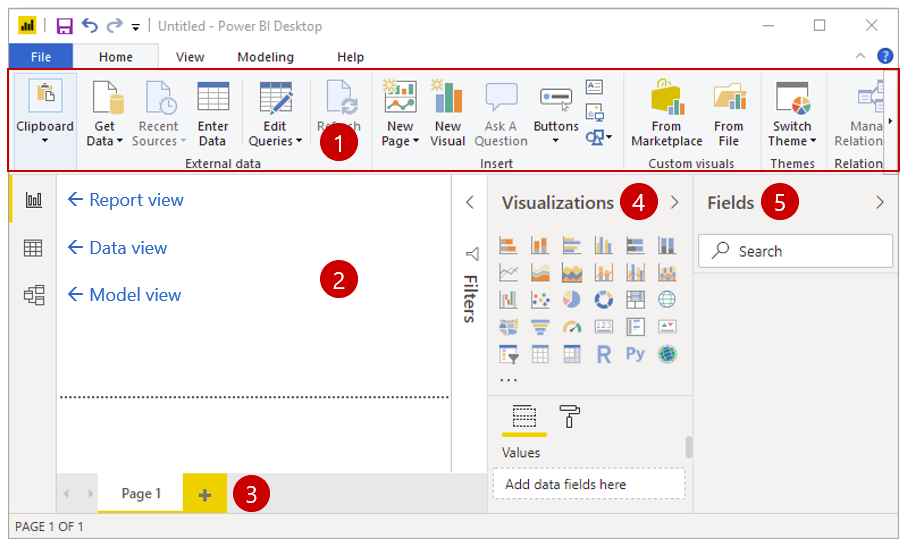
We'll now take a tour of these components, explaining the role each one plays in building a report.
The Three Main Views: Report, Data, and Model
On the left side of the screen, you'll see three small icons. These icons let you switch between the three primary views of Power BI Desktop. Each view serves a distinct purpose.
- Report View (Canvas Icon): This is the default view and your main workspace. It contains the Canvas, a blank, dotted area where you'll build, arrange, and design your visualizations. This is where you create what the end-user will see.
- Data View (Table Icon): This view lets you inspect the data in your tables. It looks and feels much like a spreadsheet. It's the perfect place to go if you want to verify that your data loaded correctly after leaving Power Query, check a specific value, or see the raw data behind a visual.
- Model View (Diagram Icon): This view shows a diagram of all the tables in your data model and, crucially, the relationships between them. For instance, you might see a line connecting your
Salestable to yourProductstable via aProductIDcolumn. We will cover relationships in more detail when we combine data from multiple tables.
To see these views in action, the following video provides a clear walkthrough.
Power BI Tutorial for Beginners
Let's watch a few clips from Kevin Stratvert's 'Power BI Tutorial for Beginners'. He provides a very clear, step-by-step tour of the interface after loading data.
Watch the following three short segments: Report View (01:52 - 02:13): See the initial, blank Report View. Data View (04:08 - 04:46): Watch how to switch to the Data View to inspect the contents of the loaded tables. Model View (06:46 - 07:18): See how the Model View visualizes tables and their relationships.
The Tool Panes: Fields, Visualizations, and Filters
On the right side of the screen are the "panes," which are collapsible menus that provide the tools you need to build reports.
- Fields Pane: This is perhaps the most important pane. It contains a list of all the tables you loaded from Power Query. You can expand each table to see its columns (or "fields"). To build a visual, you will drag fields from this pane onto the canvas or into the Visualizations pane. This is your palette of data ingredients.
- Visualizations Pane: This is your toolbox of charts and graphs. It has two main parts:
- Visual types: A grid of icons for bar charts, line charts, pie charts, maps, and more. You select the type of visual you want to create here.
- Field wells: Below the icons, you'll find "wells" (like Axis, Legend, Values) where you drag fields to configure the selected visual. For example, for a bar chart, you'd drag a category like
Regionto the Axis well and a number likeSalesto the Values well.
- Filters Pane: This pane allows you to add filters to your report. You can filter a single visual, an entire page, or all pages in the report. We will explore this in detail in a later lesson.
This next clip shows the Fields and Visualizations panes in use.
Power BI Tutorial for Beginners
Continuing with Kevin Stratvert's tutorial, let's see how the panes on the right-hand side come into play.
Watch these two segments: Fields Pane (03:56 - 04:19): See how the loaded tables and their fields appear in the Data (now called Fields) pane. Visualizations Pane (07:28 - 07:48): Observe how a visual (a line chart) is selected from the Visualizations pane and added to the canvas.
Test your understanding!
A manager in your workshop wants to accomplish two tasks:
- Quickly check the total number of rows in their newly imported
Orderstable to make sure nothing is missing. - Create their first bar chart showing
ProfitbyProduct Category.
Which View and which Pane would they use for each task?
Show answer
- To check the data in the
Orderstable, they should switch to the Data View. - To create a bar chart, they would work in the Report View. They would select the bar chart icon from the Visualizations Pane and then drag the
ProfitandProduct Categoryfields from the Fields Pane into the chart's configuration wells.
The Ribbon and Pages
Finally, two more components complete our tour:
- The Ribbon: Located at the top of the window, the Ribbon should be familiar from other Microsoft applications like Excel or Word. It contains tabs like
Home,Insert, andView, giving you access to a wide range of commands. For example, theTransform databutton we discussed in the last lesson is on theHometab. - Pages Tab: At the bottom of the window, you'll see a tab that says "Page 1". You can add more pages here, just like adding new worksheets in an Excel workbook. This allows you to create multi-page reports to organize your analysis.
Conclusion
You've now completed a full tour of the Power BI Desktop interface. Understanding the purpose of each component is the foundation for building any report. When teaching your workshop, presenting this as a "lay of the land" tour will empower your managers to navigate the tool with confidence.
Key Takeaways:
- Three Views: Use Report View to build, Data View to inspect, and Model View to see relationships.
- Three Panes: Use the Fields Pane for your data ingredients, the Visualizations Pane for your chart toolbox, and the Filters Pane to narrow down data.
- Canvas & Pages: The Canvas is where you arrange your visuals, and Pages let you organize your report into multiple sections.
- Ribbon: A familiar element for accessing various commands and options.
Preview of the Next Lesson:
Our tour is complete, and we're ready to start creating! In the next lesson, we will finally bring our data to life. You'll learn how to create bar charts to compare categories and line charts for trends, putting the Fields and Visualizations panes to practical use.